title of the thesis - Department of Geology - Queen's University
title of the thesis - Department of Geology - Queen's University
title of the thesis - Department of Geology - Queen's University
You also want an ePaper? Increase the reach of your titles
YUMPU automatically turns print PDFs into web optimized ePapers that Google loves.
expected to be responsible for a large number <strong>of</strong> non-double-couple mechanisms observed in<br />
Creighton Mine.<br />
3.4 Stress Tensor Inversion<br />
P-, T- and B-axes derived from focal mechanisms can be used as a crude approximation to<br />
principal stress orientations. Axes represent <strong>the</strong> ideal stress orientations for a given solution. In<br />
<strong>the</strong> presence <strong>of</strong> preexisting fractures, <strong>the</strong> maximum principal stresses may differ significantly<br />
from P- and T-axes and be oriented elsewhere in compressional and dilatational quadrants<br />
(Gephart and Forsyth, 1984). Indeed in Creighton Mine faults and fractures are oriented obliquely<br />
to principal stress directions, which may cause <strong>the</strong> P-, T- and B-axes to differ from principal stress<br />
orientations.<br />
One way to resolve <strong>the</strong> local stress tensor is through stress tensor inversion. Inversion was done<br />
with s<strong>of</strong>tware developed by Gephart (1990). Details <strong>of</strong> <strong>the</strong> inversion method are described in<br />
Gephart and Forsyth (1984) and <strong>the</strong> program is presented in Gephart (1990). The s<strong>of</strong>tware makes<br />
use <strong>of</strong> P- and T-axis measurements and compares different solutions to find <strong>the</strong> best fit between<br />
<strong>the</strong> predicted model and actual data with minimal error.<br />
P- and T-axes from 95 focal mechanisms for events located in proximity to <strong>the</strong> 7400 Level were<br />
used for inversion. Results from this inversion indicate that <strong>the</strong> maximum principal stress is near<br />
horizontal and oriented E-W and <strong>the</strong> minimum principal stress trends SSE and has a moderate<br />
plunge (Fig. 3.20). The best model was that with a minimum misfit <strong>of</strong> 10.62º (Fig. 3.21). The<br />
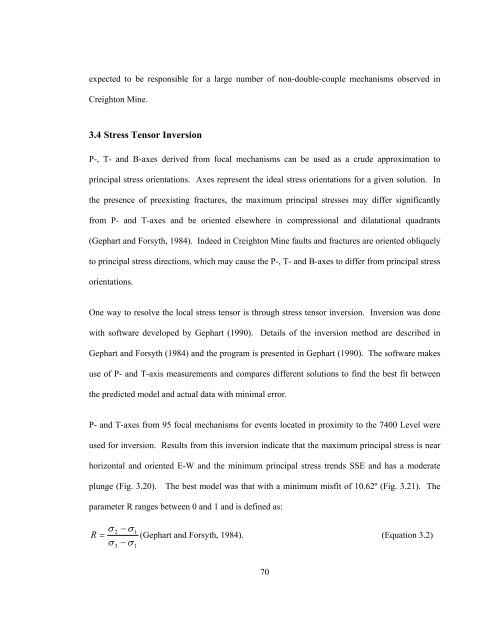
parameter R ranges between 0 and 1 and is defined as:<br />
<br />
<br />
2 1<br />
R (Gephart and Forsyth, 1984). (Equation 3.2)<br />
3<br />
1<br />
70


