sector skills plan for the health sector in south africa
sector skills plan for the health sector in south africa
sector skills plan for the health sector in south africa

You also want an ePaper? Increase the reach of your titles
YUMPU automatically turns print PDFs into web optimized ePapers that Google loves.
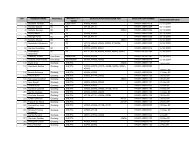
Table 3-3 Primary <strong>health</strong>care visits per prov<strong>in</strong>ce: 2008/09<br />
PHC total<br />
headcount<br />
Utilisation rateannualised<br />
Utilisation rate <strong>for</strong><br />
under 5 yr olds<br />
annualised<br />
Eastern Cape 17814953 2.6 4.3<br />
Free State 6455360 2.2 4.0<br />
Gauteng 19111520 1.9 3.6<br />
KwaZulu-Natal 24495932 2.4 4.3<br />
Limpopo 14772977 2.8 5.9<br />
Mpumalanga 7932495 2.2 4.5<br />
Nor<strong>the</strong>rn Cape 3484634 3.1 4.9<br />
North West 8329076 2.6 4.5<br />
Western Cape 14944309 3.0 5.2<br />
Total/Average 117341256 2.5 4.6<br />
Source: National Treasury. 2009. “Health”. In Prov<strong>in</strong>cial Budgets and Expenditure Review 2005/06 – 2011/12 (from district<br />
<strong>health</strong> <strong>in</strong><strong>for</strong>mation systems).<br />
Table 3-4 compares <strong>the</strong> reported number of patients treated per day by a doctor or a nurse at primary<br />
<strong>health</strong>care cl<strong>in</strong>ics per prov<strong>in</strong>ce <strong>in</strong> 2008/09. The cl<strong>in</strong>ical workload of doctors and nurses differed<br />
between prov<strong>in</strong>ces. Doctors <strong>in</strong> Mpumalanga and <strong>the</strong> Free State had <strong>the</strong> highest workload. Nurses <strong>in</strong> <strong>the</strong><br />
Free State and Western Cape had a higher workload than <strong>the</strong>ir counterparts <strong>in</strong> o<strong>the</strong>r prov<strong>in</strong>ces.<br />
Table 3-4 Primary <strong>health</strong>care workload per prov<strong>in</strong>ce: 2008/09<br />
Prov<strong>in</strong>ce<br />
Doctor cl<strong>in</strong>ical workload<br />
<strong>in</strong> PHC<br />
Nurse cl<strong>in</strong>ical workload<br />
<strong>in</strong> PHC<br />
Eastern Cape 21.5 21.7<br />
Free State 28.6 33.9<br />
Gauteng 24.2 28.5<br />
KwaZulu-Natal 24.4 23.4<br />
Limpopo 18.8 17.8<br />
Mpumalanga 29.0 21.5<br />
Nor<strong>the</strong>rn Cape 17.6 25.5<br />
North West 12.3 20.5<br />
Western Cape 24.3 31.1<br />
Total/Average 22.3 24.9<br />
Source: National Treasury. 2009. “Health”. In Prov<strong>in</strong>cial Budgets and Expenditure Review 2005/06 – 2011/12 (from district<br />
<strong>health</strong> <strong>in</strong><strong>for</strong>mation systems).<br />
Demand <strong>for</strong> <strong>health</strong>care services <strong>in</strong> <strong>the</strong> public <strong>sector</strong> cont<strong>in</strong>ues to rise and exceeds supply. Reports about<br />
lack of medic<strong>in</strong>es and equipment, as well as backlogs <strong>in</strong> payments <strong>for</strong> goods and services procured,<br />
25