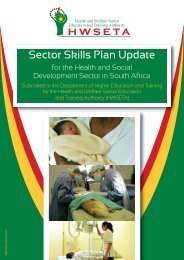
sector skills plan for the health sector in south africa
sector skills plan for the health sector in south africa
sector skills plan for the health sector in south africa

Create successful ePaper yourself
Turn your PDF publications into a flip-book with our unique Google optimized e-Paper software.
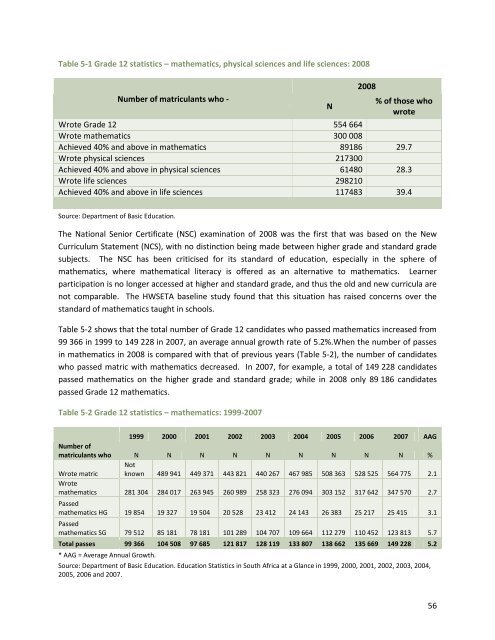
Table 5-1 Grade 12 statistics – ma<strong>the</strong>matics, physical sciences and life sciences: 2008<br />
Number of matriculants who -<br />
N<br />
2008<br />
% of those who<br />
wrote<br />
Wrote Grade 12 554 664<br />
Wrote ma<strong>the</strong>matics 300 008<br />
Achieved 40% and above <strong>in</strong> ma<strong>the</strong>matics 89186 29.7<br />
Wrote physical sciences 217300<br />
Achieved 40% and above <strong>in</strong> physical sciences 61480 28.3<br />
Wrote life sciences 298210<br />
Achieved 40% and above <strong>in</strong> life sciences 117483 39.4<br />
Source: Department of Basic Education.<br />
The National Senior Certificate (NSC) exam<strong>in</strong>ation of 2008 was <strong>the</strong> first that was based on <strong>the</strong> New<br />
Curriculum Statement (NCS), with no dist<strong>in</strong>ction be<strong>in</strong>g made between higher grade and standard grade<br />
subjects. The NSC has been criticised <strong>for</strong> its standard of education, especially <strong>in</strong> <strong>the</strong> sphere of<br />
ma<strong>the</strong>matics, where ma<strong>the</strong>matical literacy is offered as an alternative to ma<strong>the</strong>matics. Learner<br />
participation is no longer accessed at higher and standard grade, and thus <strong>the</strong> old and new curricula are<br />
not comparable. The HWSETA basel<strong>in</strong>e study found that this situation has raised concerns over <strong>the</strong><br />
standard of ma<strong>the</strong>matics taught <strong>in</strong> schools.<br />
Table 5-2 shows that <strong>the</strong> total number of Grade 12 candidates who passed ma<strong>the</strong>matics <strong>in</strong>creased from<br />
99 366 <strong>in</strong> 1999 to 149 228 <strong>in</strong> 2007, an average annual growth rate of 5.2%.When <strong>the</strong> number of passes<br />
<strong>in</strong> ma<strong>the</strong>matics <strong>in</strong> 2008 is compared with that of previous years (Table 5-2), <strong>the</strong> number of candidates<br />
who passed matric with ma<strong>the</strong>matics decreased. In 2007, <strong>for</strong> example, a total of 149 228 candidates<br />
passed ma<strong>the</strong>matics on <strong>the</strong> higher grade and standard grade; while <strong>in</strong> 2008 only 89 186 candidates<br />
passed Grade 12 ma<strong>the</strong>matics.<br />
Table 5-2 Grade 12 statistics – ma<strong>the</strong>matics: 1999-2007<br />
1999 2000 2001 2002 2003 2004 2005 2006 2007 AAG<br />
Number of<br />
matriculants who N N N N N N N N N %<br />
Wrote matric<br />
Not<br />
known 489 941 449 371 443 821 440 267 467 985 508 363 528 525 564 775 2.1<br />
Wrote<br />
ma<strong>the</strong>matics 281 304 284 017 263 945 260 989 258 323 276 094 303 152 317 642 347 570 2.7<br />
Passed<br />
ma<strong>the</strong>matics HG 19 854 19 327 19 504 20 528 23 412 24 143 26 383 25 217 25 415 3.1<br />
Passed<br />
ma<strong>the</strong>matics SG 79 512 85 181 78 181 101 289 104 707 109 664 112 279 110 452 123 813 5.7<br />
Total passes 99 366 104 508 97 685 121 817 128 119 133 807 138 662 135 669 149 228 5.2<br />
* AAG = Average Annual Growth.<br />
Source: Department of Basic Education. Education Statistics <strong>in</strong> South Africa at a Glance <strong>in</strong> 1999, 2000, 2001, 2002, 2003, 2004,<br />
2005, 2006 and 2007.<br />
56