sector skills plan for the health sector in south africa
sector skills plan for the health sector in south africa
sector skills plan for the health sector in south africa
Create successful ePaper yourself
Turn your PDF publications into a flip-book with our unique Google optimized e-Paper software.
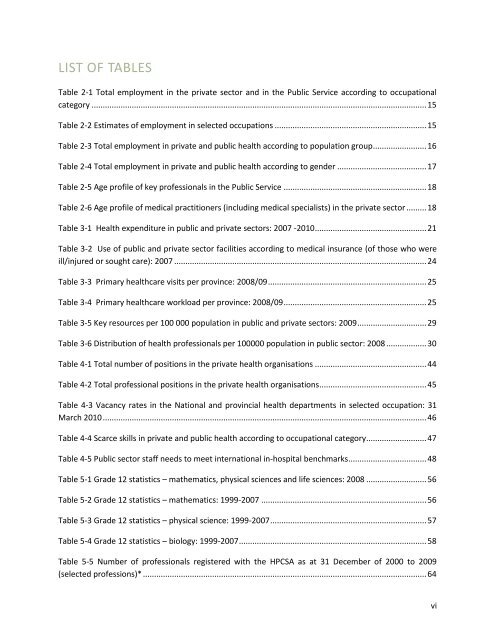
LIST OF TABLES<br />
Table 2-1 Total employment <strong>in</strong> <strong>the</strong> private <strong>sector</strong> and <strong>in</strong> <strong>the</strong> Public Service accord<strong>in</strong>g to occupational<br />
category ...................................................................................................................................................... 15<br />
Table 2-2 Estimates of employment <strong>in</strong> selected occupations .................................................................... 15<br />
Table 2-3 Total employment <strong>in</strong> private and public <strong>health</strong> accord<strong>in</strong>g to population group ........................ 16<br />
Table 2-4 Total employment <strong>in</strong> private and public <strong>health</strong> accord<strong>in</strong>g to gender ........................................ 17<br />
Table 2-5 Age profile of key professionals <strong>in</strong> <strong>the</strong> Public Service ................................................................ 18<br />
Table 2-6 Age profile of medical practitioners (<strong>in</strong>clud<strong>in</strong>g medical specialists) <strong>in</strong> <strong>the</strong> private <strong>sector</strong> ......... 18<br />
Table 3-1 Health expenditure <strong>in</strong> public and private <strong>sector</strong>s: 2007 -2010 .................................................. 21<br />
Table 3-2 Use of public and private <strong>sector</strong> facilities accord<strong>in</strong>g to medical <strong>in</strong>surance (of those who were<br />
ill/<strong>in</strong>jured or sought care): 2007 ................................................................................................................. 24<br />
Table 3-3 Primary <strong>health</strong>care visits per prov<strong>in</strong>ce: 2008/09 ....................................................................... 25<br />
Table 3-4 Primary <strong>health</strong>care workload per prov<strong>in</strong>ce: 2008/09 ................................................................ 25<br />
Table 3-5 Key resources per 100 000 population <strong>in</strong> public and private <strong>sector</strong>s: 2009 ............................... 29<br />
Table 3-6 Distribution of <strong>health</strong> professionals per 100000 population <strong>in</strong> public <strong>sector</strong>: 2008 .................. 30<br />
Table 4-1 Total number of positions <strong>in</strong> <strong>the</strong> private <strong>health</strong> organisations .................................................. 44<br />
Table 4-2 Total professional positions <strong>in</strong> <strong>the</strong> private <strong>health</strong> organisations ................................................ 45<br />
Table 4-3 Vacancy rates <strong>in</strong> <strong>the</strong> National and prov<strong>in</strong>cial <strong>health</strong> departments <strong>in</strong> selected occupation: 31<br />
March 2010 ................................................................................................................................................. 46<br />
Table 4-4 Scarce <strong>skills</strong> <strong>in</strong> private and public <strong>health</strong> accord<strong>in</strong>g to occupational category ........................... 47<br />
Table 4-5 Public <strong>sector</strong> staff needs to meet <strong>in</strong>ternational <strong>in</strong>-hospital benchmarks ................................... 48<br />
Table 5-1 Grade 12 statistics – ma<strong>the</strong>matics, physical sciences and life sciences: 2008 ........................... 56<br />
Table 5-2 Grade 12 statistics – ma<strong>the</strong>matics: 1999-2007 .......................................................................... 56<br />
Table 5-3 Grade 12 statistics – physical science: 1999-2007 ...................................................................... 57<br />
Table 5-4 Grade 12 statistics – biology: 1999-2007 .................................................................................... 58<br />
Table 5-5 Number of professionals registered with <strong>the</strong> HPCSA as at 31 December of 2000 to 2009<br />
(selected professions)* ............................................................................................................................... 64<br />
vi


