

MD&A and Financial Statements (PDF) - Banco Itaú
MD&A and Financial Statements (PDF) - Banco Itaú
MD&A and Financial Statements (PDF) - Banco Itaú

You also want an ePaper? Increase the reach of your titles
YUMPU automatically turns print PDFs into web optimized ePapers that Google loves.
Executive Summary<br />
NPL Ratio over 90 days (%)<br />
6.9%<br />
3rd Q/10<br />
2nd Q/10<br />
1st Q/10<br />
4th Q/09<br />
3rd Q/09<br />
2nd Q/09<br />
1st Q/09<br />
4th Q/08<br />
7,446<br />
7.9% 8.1% 8.1% 7.6%<br />
6.8%<br />
6.4%<br />
6.0%<br />
5.4% 5.9% 5.6%<br />
4.9%<br />
4.4%<br />
4.6%<br />
3.9%<br />
4.1% 4.0%<br />
4.3%<br />
3.1%<br />
3.3% 3.2% 2.9%<br />
1.9%<br />
1.3%<br />
Dec/08 Mar/09 Jun/09 Sep/09 Dec/09 Mar/10 Jun/10 Sep/10<br />
Individuals Total Companies<br />
Banking fees <strong>and</strong> charge revenues<br />
Non-interest Expenses<br />
6,900 6,791 6,895<br />
7,397<br />
6,722<br />
6,663<br />
3,617<br />
3,526<br />
7,570<br />
3,853<br />
4,120<br />
4,063<br />
4,451<br />
4,300<br />
4,231<br />
7,975<br />
7,335 7,569<br />
4th Q/08 1st Q/09 2nd Q/09 3rd Q/09 4th Q/09 1st Q/10 2nd Q/10 3rd Q/10<br />
Non-interest Expenses<br />
Non-interest Expenses without Branch Migration Expenses<br />
Efficiency Ratio (E.R) <strong>and</strong> Risk Adjusted<br />
Efficiency Ratio (R.A.E.R.) (%) (*)<br />
R$ million<br />
R$ million<br />
<strong>Itaú</strong> Unibanco Holding S.A.<br />
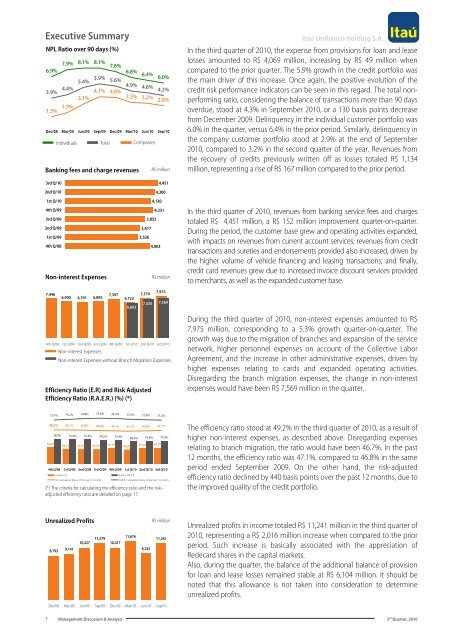
In the third quarter of 2010, the expense from provisions for loan <strong>and</strong> lease<br />
losses amounted to R$ 4,069 million, increasing by R$ 49 million when<br />
compared to the prior quarter. The 5.9% growth in the credit portfolio was<br />
the main driver of this increase. Once again, the positive evolution of the<br />
credit risk performance indicators can be seen in this regard. The total nonperforming<br />
ratio, considering the balance of transactions more than 90 days<br />
overdue, stood at 4.3% in September 2010, or a 130 basis points decrease<br />
from December 2009. Delinquency in the individual customer portfolio was<br />
6.0% in the quarter, versus 6.4% in the prior period. Similarly, delinquency in<br />
the company customer portfolio stood at 2.9% at the end of September<br />
2010, compared to 3.2% in the second quarter of the year. Revenues from<br />
the recovery of credits previously written off as losses totaled R$ 1,134<br />
million, representing a rise of R$ 167 million compared to the prior period.<br />
In the third quarter of 2010, revenues from banking service fees <strong>and</strong> charges<br />
totaled R$ 4,451 million, a R$ 152 million improvement quarter-on-quarter.<br />
During the period, the customer base grew <strong>and</strong> operating activities exp<strong>and</strong>ed,<br />
with impacts on revenues from current account services; revenues from credit<br />
transactions <strong>and</strong> sureties <strong>and</strong> endorsements provided also increased, driven by<br />
the higher volume of vehicle financing <strong>and</strong> leasing transactions; <strong>and</strong> finally,<br />
credit card revenues grew due to increased invoice discount services provided<br />
to merchants, as well as the exp<strong>and</strong>ed customer base.<br />
During the third quarter of 2010, non-interest expenses amounted to R$<br />
7,975 million, corresponding to a 5.3% growth quarter-on-quarter. The<br />
growth was due to the migration of branches <strong>and</strong> expansion of the service<br />
network, higher personnel expenses on account of the Collective Labor<br />
Agreement, <strong>and</strong> the increase in other administrative expenses, driven by<br />
higher expenses relating to cards <strong>and</strong> exp<strong>and</strong>ed operating activities.<br />
Disregarding the branch migration expenses, the change in non-interest<br />
expenses would have been R$ 7,569 million in the quarter.<br />
71.7% 73.2% 74.8% 75.6% 74.7% 73.1% 71.9% 71.2%<br />
48.2%<br />
50.6%<br />
48.1% 47.8% 46.8% 46.1% 45.5% 46.0% 47.1%<br />
76.9% 75.5% 75.5% 74.5% 73.4%<br />
46.2% 45.4% 45.0% 47.7%<br />
68.9% 70.8% 71.6%<br />
44.0% 47.3% 49.2%<br />
4th Q/08 1st Q/09 2nd Q/09 3rd Q/09 4th Q/09 1st Q/10 2nd Q/10 3rd Q/10<br />
Quarter E.R.<br />
E.R. Cumulative figure of the last 12 months<br />
Quarter R.A.E.R.<br />
R.A.E.R. Cumulative figure of the last 12 months<br />
(*) The criteria for calculating the efficiency ratio <strong>and</strong> the risk–<br />
adjusted efficiency ratio are detailed on page 17.<br />
The efficiency ratio stood at 49.2% in the third quarter of 2010, as a result of<br />
higher non-interest expenses, as described above. Disregarding expenses<br />
relating to branch migration, the ratio would have been 46.7%. In the past<br />
12 months, the efficiency ratio was 47.1%, compared to 46.8% in the same<br />
period ended September 2009. On the other h<strong>and</strong>, the risk-adjusted<br />
efficiency ratio declined by 440 basis points over the past 12 months, due to<br />
the improved quality of the credit portfolio.<br />
Unrealized Profits<br />
R$ million<br />
11,279<br />
11,676<br />
11,241<br />
10,427<br />
10,417<br />
8,792<br />
9,141<br />
9,225<br />
Dec/08 Mar/09 Jun/09 Sep/09 Dec/09 Mar/10 Jun/10 Sep/10<br />
Unrealized profits in income totaled R$ 11,241 million in the third quarter of<br />
2010, representing a R$ 2,016 million increase when compared to the prior<br />
period. Such increase is basically associated with the appreciation of<br />
Redecard shares in the capital markets.<br />
Also, during the quarter, the balance of the additional balance of provision<br />
for loan <strong>and</strong> lease losses remained stable at R$ 6,104 million. It should be<br />
noted that this allowance is not taken into consideration to determine<br />
unrealized profits.<br />
7<br />
Management Discussion & Analysis 3 rd Quarter, 2010


