

MD&A and Financial Statements (PDF) - Banco Itaú
MD&A and Financial Statements (PDF) - Banco Itaú
MD&A and Financial Statements (PDF) - Banco Itaú

Create successful ePaper yourself
Turn your PDF publications into a flip-book with our unique Google optimized e-Paper software.
Ownership Structure<br />
Management of our ownership structure is mainly<br />
intended to optimize the capital allocation to the various<br />
segments comprising the conglomerate.<br />
<strong>Itaú</strong> Unibanco Holding S.A.<br />
The average acquisition cost of treasury shares, as well as<br />
the activity of options granted to conglomerate executives<br />
under the Option Plan, are set out in Note 16-f to the<br />
Complete <strong>Financial</strong> <strong>Statements</strong>.<br />
The table below shows the number of shares of capital stock <strong>and</strong> treasury shares as of September 30, 2010:<br />
In thous<strong>and</strong>s<br />
ITAÚ UNIBANCO HOLDING S.A. Common Shares Non-voting Shares Total<br />
Balance of Shares 2,289,286 2,281,650 4,570,936<br />
Treasury Shares 2 30,472 30,474<br />
Total Shares (-) Treasury 2,289,284 2,251,178 4,540,462<br />
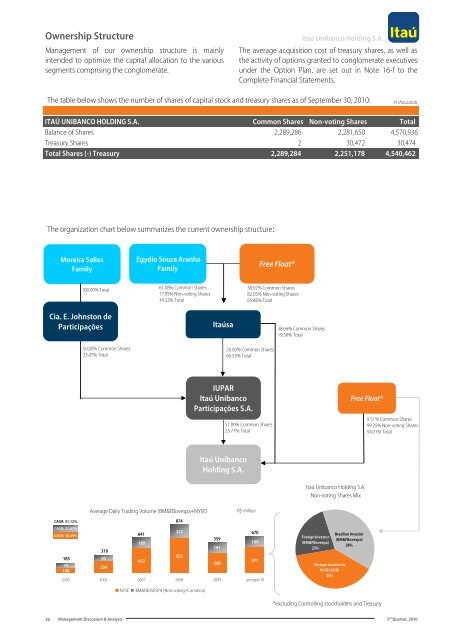
The organization chart below summarizes the current ownership structure:<br />
Moreira Salles<br />
Family<br />
Egydio Souza Aranha<br />
Family<br />
Free Float*<br />
100.00% Total<br />
61.08% Common Shares<br />
17.95% Non-voting Shares<br />
34.52% Total<br />
38.92% Common Shares<br />
82.05% Non-voting Shares<br />
65.48% Total<br />
Cia. E. Johnston de<br />
Participações<br />
50.00% Common Shares<br />
33.47% Total<br />
<strong>Itaú</strong>sa<br />
50.00% Common Shares<br />
66.53% Total<br />
38.66% Common Shares<br />
19.50% Total<br />
IUPAR<br />
<strong>Itaú</strong> Unibanco<br />
Participações S.A.<br />
51.00% Common Shares<br />
25.71% Total<br />
Free Float*<br />
9.51% Common Shares<br />
99.25% Non-voting Shares<br />
54.01% Total<br />
<strong>Itaú</strong> Unibanco<br />
Holding S.A.<br />
<strong>Itaú</strong> Unibanco Holding S.A.<br />
Non-voting Shares Mix<br />
Average Daily Trading Volume (BM&FBovespa+NYSE)<br />
CAGR: 31.12%<br />
874<br />
CAGR: 21.47%<br />
CAGR: 36.89%<br />
641<br />
242<br />
189<br />
319<br />
185<br />
95<br />
452<br />
632<br />
79<br />
106<br />
224<br />
R$ million<br />
670<br />
559<br />
199<br />
191<br />
471<br />
368<br />
2005 2006 2007 2008 2009 jan-sept/10<br />
Foreign Investor<br />
(BM&FBovespa)<br />
23%<br />
Foreign Investor in<br />
NYSE (ADR)<br />
39%<br />
Brazilian Investor<br />
(BM&FBovespa)<br />
38%<br />
NYSE<br />
BM&FBOVESPA (Non-voting+Common)<br />
*excluding Controlling stockholders <strong>and</strong> Treasury<br />
26<br />
Management Discussion & Analysis 3 rd Quarter, 2010


