

MD&A and Financial Statements (PDF) - Banco Itaú
MD&A and Financial Statements (PDF) - Banco Itaú
MD&A and Financial Statements (PDF) - Banco Itaú

Create successful ePaper yourself
Turn your PDF publications into a flip-book with our unique Google optimized e-Paper software.
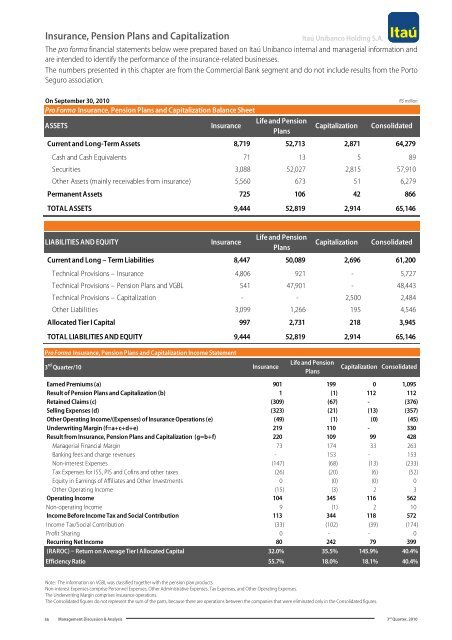
Insurance, Pension Plans <strong>and</strong> Capitalization<br />
<strong>Itaú</strong> Unibanco Holding S.A.<br />
The pro forma financial statements below were prepared based on <strong>Itaú</strong> Unibanco internal <strong>and</strong> managerial information <strong>and</strong><br />
are intended to identify the performance of the insurance-related businesses.<br />
The numbers presented in this chapter are from the Commercial Bank segment <strong>and</strong> do not include results from the Porto<br />
Seguro association.<br />
On September 30, 2010<br />
Pro Forma Insurance, Pension Plans <strong>and</strong> Capitalization Balance Sheet<br />
Life <strong>and</strong> Pension<br />
ASSETS<br />
Insurance<br />
Plans<br />
Capitalization<br />
Consolidated<br />
Current <strong>and</strong> Long-Term Assets 8,719 52,713 2,871 64,279<br />
Cash <strong>and</strong> Cash Equivalents 71 13 5 89<br />
Securities 3,088 52,027 2,815 57,910<br />
Other Assets (mainly receivables from insurance) 5,560 673 51 6,279<br />
Permanent Assets 725 106 42 866<br />
TOTAL ASSETS 9,444 52,819 2,914 65,146<br />
R$ million<br />
LIABILITIES AND EQUITY<br />
Insurance<br />
Life <strong>and</strong> Pension<br />
Plans<br />
Capitalization<br />
Consolidated<br />
Current <strong>and</strong> Long – Term Liabilities 8,447 50,089 2,696 61,200<br />
Technical Provisions – Insurance 4,806 921 - 5,727<br />
Technical Provisions – Pension Plans <strong>and</strong> VGBL 541 47,901 - 48,443<br />
Technical Provisions – Capitalization - - 2,500 2,484<br />
Other Liabilities 3,099 1,266 195 4,546<br />
Allocated Tier I Capital 997 2,731 218 3,945<br />
TOTAL LIABILITIES AND EQUITY 9,444 52,819 2,914 65,146<br />
Pro Forma Insurance, Pension Plans <strong>and</strong> Capitalization Income Statement<br />
3 rd Quarter/10 Insurance<br />
Life <strong>and</strong> Pension<br />
Plans<br />
Capitalization<br />
Consolidated<br />
Earned Premiums (a) 901 199 0 1,095<br />
Result of Pension Plans <strong>and</strong> Capitalization (b) 1 (1) 112 112<br />
Retained Claims (c) (309) (67) - (376)<br />
Selling Expenses (d) (323) (21) (13) (357)<br />
Other Operating Income/(Expenses) of Insurance Operations (e) (49) (1) (0) (45)<br />
Underwriting Margin (f=a+c+d+e) 219 110 - 330<br />
Result from Insurance, Pension Plans <strong>and</strong> Capitalization (g=b+f) 220 109 99 428<br />
Managerial <strong>Financial</strong> Margin 73 174 33 263<br />
Banking fees <strong>and</strong> charge revenues - 153 - 153<br />
Non-interest Expenses (147) (68) (13) (233)<br />
Tax Expenses for ISS, PIS <strong>and</strong> Cofins <strong>and</strong> other taxes (26) (20) (6) (52)<br />
Equity in Earnings of Affiliates <strong>and</strong> Other Investments 0 (0) (0) 0<br />
Other Operating Income (15) (3) 2 3<br />
Operating Income 104 345 116 562<br />
Non-operating Income 9 (1) 2 10<br />
Income Before Income Tax <strong>and</strong> Social Contribution 113 344 118 572<br />
Income Tax/Social Contribution (33) (102) (39) (174)<br />
Profit Sharing 0 - - 0<br />
Recurring Net Income 80 242 79 399<br />
(RAROC) – Return on Average Tier I Allocated Capital 32.0% 35.5% 145.9% 40.4%<br />
Efficiency Ratio 55.7% 18.0% 18.1% 40.4%<br />
Note: The information on VGBL was classified together with the pension plan products.<br />
Non-interest Expenses comprise Personnel Expenses, Other Administrative Expenses, Tax Expenses, <strong>and</strong> Other Operating Expenses.<br />
The Underwriting Margin comprises insurance operations.<br />
The Consolidated figures do not represent the sum of the parts, because there are operations between the companies that were eliminated only in the Consolidated figures.<br />
36<br />
Management Discussion & Analysis 3 rd Quarter, 2010


