

MD&A and Financial Statements (PDF) - Banco Itaú
MD&A and Financial Statements (PDF) - Banco Itaú
MD&A and Financial Statements (PDF) - Banco Itaú

You also want an ePaper? Increase the reach of your titles
YUMPU automatically turns print PDFs into web optimized ePapers that Google loves.
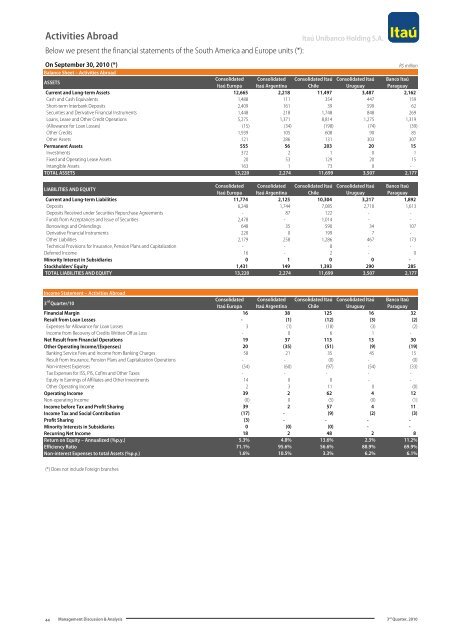
Activities Abroad<br />
Below we present the financial statements of the South America <strong>and</strong> Europe units (*):<br />
<strong>Itaú</strong> Unibanco Holding S.A.<br />
On September 30, 2010 (*)<br />
R$ million<br />
Balance Sheet – Activities Abroad<br />
ASSETS<br />
Consolidated Consolidated Consolidated <strong>Itaú</strong> Consolidated <strong>Itaú</strong> <strong>Banco</strong> <strong>Itaú</strong><br />
<strong>Itaú</strong> Europa <strong>Itaú</strong> Argentina<br />
Chile<br />
Uruguay<br />
Paraguay<br />
Current <strong>and</strong> Long-term Assets 12,665 2,218 11,497 3,487 2,162<br />
Cash <strong>and</strong> Cash Equivalents 1,488 111 354 447 159<br />
Short-term Interbank Deposits 2,409 161 39 599 62<br />
Securities <strong>and</strong> Derivative <strong>Financial</strong> Instruments 1,448 218 1,748 848 269<br />
Loans, Lease <strong>and</strong> Other Credit Operations 5,275 1,371 8,814 1,275 1,319<br />
(Allowance for Loan Losses) (15) (34) (198) (74) (39)<br />
Other Credits 1,939 105 608 90 85<br />
Other Assets 121 286 131 303 307<br />
Permanent Assets 555 56 203 20 15<br />
Investments 372 2 1 0 1<br />
Fixed <strong>and</strong> Operating Lease Assets 20 53 129 20 15<br />
Intangible Assets 163 1 73 0 -<br />
TOTAL ASSETS 13,220 2,274 11,699 3,507 2,177<br />
LIABILITIES AND EQUITY<br />
Consolidated Consolidated Consolidated <strong>Itaú</strong> Consolidated <strong>Itaú</strong> <strong>Banco</strong> <strong>Itaú</strong><br />
<strong>Itaú</strong> Europa <strong>Itaú</strong> Argentina<br />
Chile<br />
Uruguay<br />
Paraguay<br />
Current <strong>and</strong> Long-term Liabilities 11,774 2,125 10,304 3,217 1,892<br />
Deposits 6,248 1,744 7,085 2,710 1,613<br />
Deposits Received under Securities Repurchase Agreements - 87 122 - -<br />
Funds from Acceptances <strong>and</strong> Issue of Securities 2,478 - 1,014 - -<br />
Borrowings <strong>and</strong> Onlendings 648 35 590 34 107<br />
Derivative <strong>Financial</strong> Instruments 220 0 199 7 -<br />
Other Liabilities 2,179 258 1,286 467 173<br />
Technical Provisions for Insurance, Pension Plans <strong>and</strong> Capitalization - - 8 - -<br />
Deferred Income 16 - 2 - 0<br />
Minority Interest in Subsidiaries 0 1 0 0 -<br />
Stockholders' Equity 1,431 149 1,393 290 285<br />
TOTAL LIABILITIES AND EQUITY 13,220 2,274 11,699 3,507 2,177<br />
Income Statement – Activities Abroad<br />
3 rd Quarter/10<br />
Consolidated Consolidated Consolidated <strong>Itaú</strong> Consolidated <strong>Itaú</strong> <strong>Banco</strong> <strong>Itaú</strong><br />
<strong>Itaú</strong> Europa <strong>Itaú</strong> Argentina<br />
Chile<br />
Uruguay<br />
Paraguay<br />
<strong>Financial</strong> Margin 16 38 125 16 32<br />
Result from Loan Losses - (1) (12) (3) (2)<br />
Expenses for Allowance for Loan Losses 3 (1) (18) (3) (2)<br />
Income from Recovery of Credits Written Off as Loss - 0 6 1 -<br />
Net Result from <strong>Financial</strong> Operations 19 37 113 13 30<br />
Other Operating Income/(Expenses) 20 (35) (51) (9) (19)<br />
Banking Service Fees <strong>and</strong> Income from Banking Charges 58 21 35 45 15<br />
Result from Insurance, Pension Plans <strong>and</strong> Capitalization Operations - - (0) - (0)<br />
Non-interest Expenses (54) (60) (97) (54) (33)<br />
Tax Expenses for ISS, PIS, Cofins <strong>and</strong> Other Taxes - - - - -<br />
Equity in Earnings of Affiliates <strong>and</strong> Other Investments 14 0 0 - -<br />
Other Operating Income 2 3 11 0 (0)<br />
Operating Income 39 2 62 4 12<br />
Non-operating Income (0) 0 (5) (0) (1)<br />
Income before Tax <strong>and</strong> Profit Sharing 39 2 57 4 11<br />
Income Tax <strong>and</strong> Social Contribution (17) - (9) (2) (3)<br />
Profit Sharing (3) - - - -<br />
Minority Interests in Subsidiaries 0 (0) (0) - -<br />
Recurring Net Income 18 2 48 2 8<br />
Return on Equity – Annualized (%p.y.) 5.3% 4.8% 13.6% 2.3% 11.2%<br />
Efficiency Ratio 71.1% 95.6% 56.6% 88.9% 69.9%<br />
Non-interest Expenses to total Assets (%p.y.) 1.6% 10.5% 3.3% 6.2% 6.1%<br />
(*) Does not include Foreign branches<br />
44<br />
Management Discussion & Analysis 3 rd Quarter, 2010


