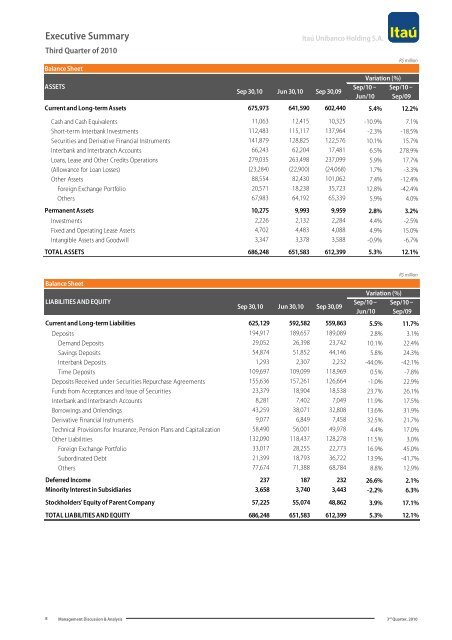
Executive Summary Third Quarter of 2010 Balance Sheet ASSETS Sep 30,10 Jun 30,10 Sep 30,09 <strong>Itaú</strong> Unibanco Holding S.A. Sep/10 – Jun/10 Variation (%) Sep/10 – Sep/09 Current <strong>and</strong> Long-term Assets 675,973 641,590 602,440 5.4% 12.2% Cash <strong>and</strong> Cash Equivalents 11,063 12,415 10,325 -10.9% 7.1% Short-term Interbank Investments 112,483 115,117 137,964 -2.3% -18.5% Securities <strong>and</strong> Derivative <strong>Financial</strong> Instruments 141,879 128,825 122,576 10.1% 15.7% Interbank <strong>and</strong> Interbranch Accounts 66,243 62,204 17,481 6.5% 278.9% Loans, Lease <strong>and</strong> Other Credits Operations 279,035 263,498 237,099 5.9% 17.7% (Allowance for Loan Losses) (23,284) (22,900) (24,068) 1.7% -3.3% Other Assets 88,554 82,430 101,062 7.4% -12.4% Foreign Exchange Portfolio 20,571 18,238 35,723 12.8% -42.4% Others 67,983 64,192 65,339 5.9% 4.0% Permanent Assets 10,275 9,993 9,959 2.8% 3.2% Investments 2,226 2,132 2,284 4.4% -2.5% Fixed <strong>and</strong> Operating Lease Assets 4,702 4,483 4,088 4.9% 15.0% Intangible Assets <strong>and</strong> Goodwill 3,347 3,378 3,588 -0.9% -6.7% TOTAL ASSETS 686,248 651,583 612,399 5.3% 12.1% R$ million Balance Sheet LIABILITIES AND EQUITY Sep 30,10 Jun 30,10 Sep 30,09 Sep/10 – Jun/10 Variation (%) R$ million Sep/10 – Sep/09 Current <strong>and</strong> Long-term Liabilities 625,129 592,582 559,863 5.5% 11.7% Deposits 194,917 189,657 189,089 2.8% 3.1% Dem<strong>and</strong> Deposits 29,052 26,398 23,742 10.1% 22.4% Savings Deposits 54,874 51,852 44,146 5.8% 24.3% Interbank Deposits 1,293 2,307 2,232 -44.0% -42.1% Time Deposits 109,697 109,099 118,969 0.5% -7.8% Deposits Received under Securities Repurchase Agreements 155,636 157,261 126,664 -1.0% 22.9% Funds from Acceptances <strong>and</strong> Issue of Securities 23,379 18,904 18,538 23.7% 26.1% Interbank <strong>and</strong> Interbranch Accounts 8,281 7,402 7,049 11.9% 17.5% Borrowings <strong>and</strong> Onlendings 43,259 38,071 32,808 13.6% 31.9% Derivative <strong>Financial</strong> Instruments 9,077 6,849 7,458 32.5% 21.7% Technical Provisions for Insurance, Pension Plans <strong>and</strong> Capitalization 58,490 56,001 49,978 4.4% 17.0% Other Liabilities 132,090 118,437 128,278 11.5% 3.0% Foreign Exchange Portfolio 33,017 28,255 22,773 16.9% 45.0% Subordinated Debt 21,399 18,793 36,722 13.9% -41.7% Others 77,674 71,388 68,784 8.8% 12.9% Deferred Income 237 187 232 26.6% 2.1% Minority Interest in Subsidiaries 3,658 3,740 3,443 -2.2% 6.3% Stockholders' Equity of Parent Company 57,225 55,074 48,862 3.9% 17.1% TOTAL LIABILITIES AND EQUITY 686,248 651,583 612,399 5.3% 12.1% 8 Management Discussion & Analysis 3 rd Quarter, 2010
Executive Summary Third Quarter of 2010 Income Statement 3 rd Q/10 2 nd Q/10 jan-sep/10 jan-sep/09 <strong>Itaú</strong> Unibanco Holding S.A. 3 rd Q/10 – 2 nd Q/10 % Variation jan-sep/10 – jan-sep/09 % R$ million Managerial <strong>Financial</strong> Margin 11,204 10,892 32,485 31,933 312 2.9% 552 1.7% <strong>Financial</strong> Margin with Clients 10,298 10,001 29,669 27,800 297 3.0% 1,869 6.7% <strong>Financial</strong> Margin with Market 906 891 2,816 4,133 16 1.7% (1,317) -31.9% Result of Loan Losses (2,935) (3,053) (9,008) (10,942) 118 -3.9% 1,934 -17.7% Expenses for Allowance for Loan Losses (4,069) (4,019) (11,954) (12,383) (49) 1.2% 428 -3.5% Income from Recovery of Credits Written Off as Loss 1,134 967 2,946 1,440 167 17.3% 1,506 104.6% Net Result from <strong>Financial</strong> Operations 8,269 7,839 23,476 20,991 430 5.5% 2,486 11.8% Other Operating Income/(Expenses) (3,593) (3,121) (9,259) (9,571) (473) 15.2% 312 -3.3% Banking Service Fees <strong>and</strong> Income from Banking Charges 4,451 4,300 12,870 10,996 152 3.5% 1,874 17.0% Result from Insurance, Pension Plans <strong>and</strong> Capitalization Operations 685 719 2,051 1,721 (34) -4.7% 330 19.2% Non-interest Expenses (7,975) (7,570) (22,266) (20,586) (405) 5.3% (1,680) 8.2% Tax Expenses for ISS, PIS, Cofins <strong>and</strong> Other Taxes (913) (970) (2,749) (2,378) 57 -5.9% (371) 15.6% Equity in earnings of affiliates <strong>and</strong> Other investments 64 45 180 180 19 42.8% 0 0.1% Other Operating Income 94 357 654 496 (262) -73.6% 158 31.9% Operating Income 4,676 4,719 14,217 11,419 (43) -0.9% 2,798 24.5% Non-operating Income 3 (1) 21 53 5 -326.9% (31) -59.4% Income before Tax <strong>and</strong> Profit Sharing 4,679 4,717 14,239 11,472 (38) -0.8% 2,767 24.1% Income Tax <strong>and</strong> Social Contribution (1,253) (1,119) (3,733) (3,006) (134) 12.0% (728) 24.2% Profit Sharing (52) (54) (169) (166) 2 -3.2% (2) 1.3% Minority Interests in Subsidiaries (216) (247) (713) (623) 31 -12.4% (90) 14.5% Recurring Net Income 3,158 3,298 9,624 7,677 (140) -4.2% 1,946 25.4% We present below another perspective on the income statement, highlighting the Managerial <strong>Financial</strong> Margin plus Banking Service Fees, which is primarily derived from the sum of the main items composing revenues from the banking <strong>and</strong> insurance, pension plans <strong>and</strong> capitalization operations. Income Statement 3 rd Q/10 2 nd Q/10 jan-sep/10 jan-sep/09 3 rd Q/10 – 2 nd Q/10 Recurring Net Income 3,158 3,298 9,624 7,677 (140) -4.2% 1,946 25.4% Note: Other Results are composed of Equity in earnings of affiliates <strong>and</strong> other investments <strong>and</strong> Non-operating Income. % Variation jan-sep/10 – jan-sep/09 R$ million Managerial <strong>Financial</strong> Margin Plus Banking Service Fees 17,124 16,959 50,241 47,594 166 1.0% 2,647 5.6% <strong>Financial</strong> Margin with Clients 10,298 10,001 29,669 27,800 297 3.0% 1,869 6.7% <strong>Financial</strong> Margin with Market 906 891 2,816 4,133 16 1.7% (1,317) -31.9% Banking Service Fees <strong>and</strong> Income from Banking Charges 4,451 4,300 12,870 10,996 152 3.5% 1,874 17.0% Result from Insurance, Pension Plans <strong>and</strong> Capitalization Operations Before Retained Claims 1,374 1,411 4,233 4,170 (36) -2.6% 63 1.5% Other Operating Income 94 357 654 496 (262) -73.6% 158 31.9% Loan Losses <strong>and</strong> Retained Claims (3,624) (3,745) (11,190) (13,391) 120 -3.2% 2,201 -16.4% Expenses for Allowance for Loan Losses (4,069) (4,019) (11,954) (14,070) (49) 1.2% 2,115 -15.0% Reversal (increase) of additional provision for loan losses - - - 1,687 - - (1,687) -100.0% Income from Recovery of Credits Written Off as Loss 1,134 967 2,946 1,440 167 17.3% 1,506 104.6% Retained Claims (689) (692) (2,181) (2,448) 3 -0.4% 267 -10.9% Operating Margin 13,500 13,214 39,052 34,204 286 2.2% 4,848 14.2% Other Operating Income/(Expenses) (8,820) (8,497) (24,813) (22,732) (324) 3.8% (2,082) 9.2% Non-interest Expenses (7,975) (7,570) (22,266) (20,586) (405) 5.3% (1,680) 8.2% Tax Expenses for ISS, PIS, Cofins <strong>and</strong> Other Taxes (913) (970) (2,749) (2,378) 57 -5.9% (371) 15.6% Other Results 67 43 202 233 24 55.4% (31) -13.4% Income before Tax <strong>and</strong> Profit Sharing 4,679 4,717 14,239 11,472 (38) -0.8% 2,767 24.1% Income Tax <strong>and</strong> Social Contribution (1,253) (1,119) (3,733) (3,006) (134) 12.0% (728) 24.2% Profit Sharing (52) (54) (169) (166) 2 -3.2% (2) 1.3% Minority Interests in Subsidiaries (216) (247) (713) (623) 31 -12.4% (90) 14.5% The recurring net income for the first nine months of 2010 was R$ 9,624 million, up 25.4% from the same period of 2009. This result is primarily attributable to a 6.7% increase in the financial margin with clients, 17.0% growth in revenues from banking service fees <strong>and</strong> charges, <strong>and</strong> a 17.7% rise in the result of loan <strong>and</strong> lease losses. During the period, non-interest expenses increased by 8.2%, mainly due to the migration of Unibanco branches to the <strong>Itaú</strong> platform, completed in October 2010. % 9 Management Discussion & Analysis 3 rd Quarter, 2010