

MD&A and Financial Statements (PDF) - Banco Itaú
MD&A and Financial Statements (PDF) - Banco Itaú
MD&A and Financial Statements (PDF) - Banco Itaú

Create successful ePaper yourself
Turn your PDF publications into a flip-book with our unique Google optimized e-Paper software.
Analysis of the Net Income<br />
<strong>Itaú</strong> Unibanco Holding S.A.<br />
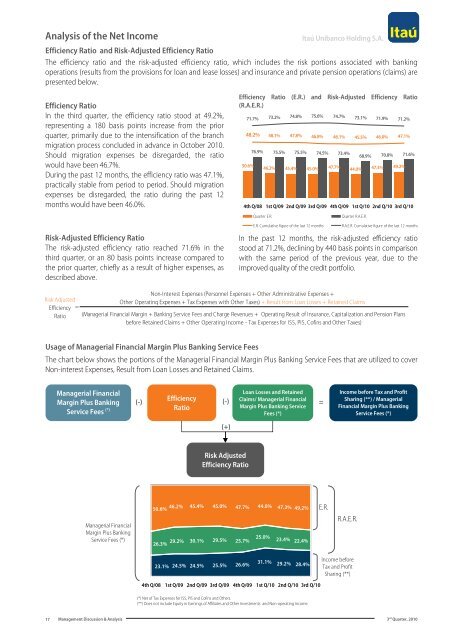
Efficiency Ratio <strong>and</strong> Risk-Adjusted Efficiency Ratio<br />
The efficiency ratio <strong>and</strong> the risk-adjusted efficiency ratio, which includes the risk portions associated with banking<br />
operations (results from the provisions for loan <strong>and</strong> lease losses) <strong>and</strong> insurance <strong>and</strong> private pension operations (claims) are<br />
presented below.<br />
Efficiency Ratio<br />
In the third quarter, the efficiency ratio stood at 49.2%,<br />
representing a 180 basis points increase from the prior<br />
quarter, primarily due to the intensification of the branch<br />
migration process concluded in advance in October 2010.<br />
Should migration expenses be disregarded, the ratio<br />
would have been 46.7%.<br />
During the past 12 months, the efficiency ratio was 47.1%,<br />
practically stable from period to period. Should migration<br />
expenses be disregarded, the ratio during the past 12<br />
months would have been 46.0%.<br />
Efficiency Ratio (E.R.) <strong>and</strong> Risk-Adjusted Efficiency Ratio<br />
(R.A.E.R.)<br />
71.7% 73.2% 74.8% 75.6% 74.7% 73.1% 71.9% 71.2%<br />
48.2%<br />
50.6%<br />
48.1% 47.8% 46.8% 46.1% 45.5% 46.0% 47.1%<br />
76.9% 75.5% 75.5% 74.5% 73.4%<br />
46.2% 45.4% 45.0% 47.7%<br />
68.9% 70.8% 71.6%<br />
44.0% 47.3% 49.2%<br />
4th Q/08 1st Q/09 2nd Q/09 3rd Q/09 4th Q/09 1st Q/10 2nd Q/10 3rd Q/10<br />
Quarter E.R.<br />
Quarter R.A.E.R.<br />
Risk-Adjusted Efficiency Ratio<br />
The risk-adjusted efficiency ratio reached 71.6% in the<br />
third quarter, or an 80 basis points increase compared to<br />
the prior quarter, chiefly as a result of higher expenses, as<br />
described above.<br />
E.R. Cumulative figure of the last 12 months<br />
R.A.E.R. Cumulative figure of the last 12 months<br />
In the past 12 months, the risk-adjusted efficiency ratio<br />
stood at 71.2%, declining by 440 basis points in comparison<br />
with the same period of the previous year, due to the<br />
improved quality of the credit portfolio.<br />
Risk Adjusted<br />
Efficiency =<br />
Ratio<br />
Non-Interest Expenses (Personnel Expenses + Other Administrative Expenses +<br />
Other Operating Expenses + Tax Expenses with Other Taxes) + Result from Loan Losses + Retained Claims<br />
(Managerial <strong>Financial</strong> Margin + Banking Service Fees <strong>and</strong> Charge Revenues + Operating Result of Insurance, Capitalization <strong>and</strong> Pension Plans<br />
before Retained Claims + Other Operating Income - Tax Expenses for ISS, PIS, Cofins <strong>and</strong> Other Taxes)<br />
Usage of Managerial <strong>Financial</strong> Margin Plus Banking Service Fees<br />
The chart below shows the portions of the Managerial <strong>Financial</strong> Margin Plus Banking Service Fees that are utilized to cover<br />
Non-interest Expenses, Result from Loan Losses <strong>and</strong> Retained Claims.<br />
Managerial <strong>Financial</strong><br />
Margin Plus Banking<br />
Service Fees (*)<br />
(-)<br />
Efficiency<br />
Ratio<br />
(-)<br />
Loan Losses <strong>and</strong> Retained<br />
Claims/ Managerial <strong>Financial</strong><br />
Margin Plus Banking Service<br />
Fees (*)<br />
=<br />
Income before Tax <strong>and</strong> Profit<br />
Sharing (**) / Managerial<br />
<strong>Financial</strong> Margin Plus Banking<br />
Service Fees (*)<br />
(+)<br />
Risk Adjusted<br />
Efficiency Ratio<br />
Managerial <strong>Financial</strong><br />
Margin Plus Banking<br />
Service Fees (*)<br />
46.2% 45.4% 45.0% 47.7% 44.0%<br />
50.6%<br />
47.3% 49.2%<br />
25.0%<br />
29.2% 30.1% 29.5% 25.7%<br />
23.4% 22.4%<br />
26.3%<br />
E.R.<br />
R.A.E.R.<br />
24.5% 25.5% 26.6%<br />
31.1%<br />
23.1% 24.5% 29.2% 28.4%<br />
4th Q/08 1st Q/09 2nd Q/09 3rd Q/09 4th Q/09 1st Q/10 2nd Q/10 3rd Q/10<br />
(*) Net of Tax Expenses for ISS, PIS <strong>and</strong> Cofins <strong>and</strong> Others.<br />
(**) Does not include Equity in Earnings of Affiliates <strong>and</strong> Other Investments <strong>and</strong> Non-operating Income.<br />
Income before<br />
Tax <strong>and</strong> Profit<br />
Sharing (**)<br />
17<br />
Management Discussion & Analysis 3 rd Quarter, 2010


