

MD&A and Financial Statements (PDF) - Banco Itaú
MD&A and Financial Statements (PDF) - Banco Itaú
MD&A and Financial Statements (PDF) - Banco Itaú

Create successful ePaper yourself
Turn your PDF publications into a flip-book with our unique Google optimized e-Paper software.
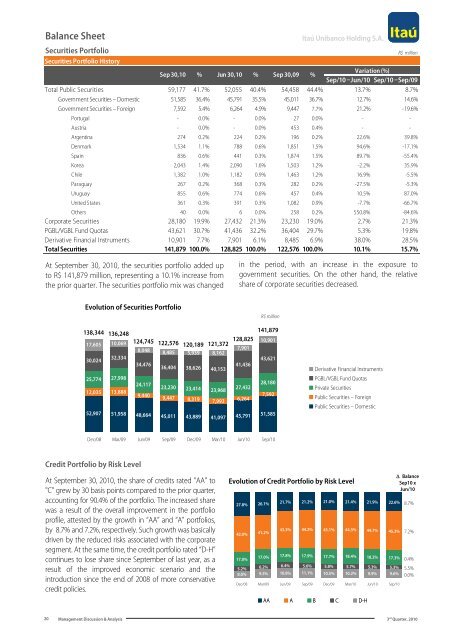
Balance Sheet<br />
Securities Portfolio<br />
Securities Portfolio History<br />
<strong>Itaú</strong> Unibanco Holding S.A.<br />
R$ million<br />
Sep 30,10 % Jun 30,10 % Sep 30,09 %<br />
Variation (%)<br />
Sep/10 –Jun/10 Sep/10 –Sep/09<br />
Total Public Securities 59,177 41.7% 52,055 40.4% 54,458 44.4% 13.7% 8.7%<br />
Government Securities – Domestic 51,585 36.4% 45,791 35.5% 45,011 36.7% 12.7% 14.6%<br />
Government Securities – Foreign 7,592 5.4% 6,264 4.9% 9,447 7.7% 21.2% -19.6%<br />
Portugal - 0.0% - 0.0% 27 0.0% - -<br />
Austria - 0.0% - 0.0% 453 0.4% - -<br />
Argentina 274 0.2% 224 0.2% 196 0.2% 22.6% 39.8%<br />
Denmark 1,534 1.1% 788 0.6% 1,851 1.5% 94.6% -17.1%<br />
Spain 836 0.6% 441 0.3% 1,874 1.5% 89.7% -55.4%<br />
Korea 2,043 1.4% 2,090 1.6% 1,503 1.2% -2.2% 35.9%<br />
Chile 1,382 1.0% 1,182 0.9% 1,463 1.2% 16.9% -5.5%<br />
Paraguay 267 0.2% 368 0.3% 282 0.2% -27.5% -5.3%<br />
Uruguay 855 0.6% 774 0.6% 457 0.4% 10.5% 87.0%<br />
United States 361 0.3% 391 0.3% 1,082 0.9% -7.7% -66.7%<br />
Others 40 0.0% 6 0.0% 258 0.2% 550.8% -84.6%<br />
Corporate Securities 28,180 19.9% 27,432 21.3% 23,230 19.0% 2.7% 21.3%<br />
PGBL/VGBL Fund Quotas 43,621 30.7% 41,436 32.2% 36,404 29.7% 5.3% 19.8%<br />
Derivative <strong>Financial</strong> Instruments 10,901 7.7% 7,901 6.1% 8,485 6.9% 38.0% 28.5%<br />
Total Securities 141,879 100.0% 128,825 100.0% 122,576 100.0% 10.1% 15.7%<br />
At September 30, 2010, the securities portfolio added up<br />
to R$ 141,879 million, representing a 10.1% increase from<br />
the prior quarter. The securities portfolio mix was changed<br />
in the period, with an increase in the exposure to<br />
government securities. On the other h<strong>and</strong>, the relative<br />
share of corporate securities decreased.<br />
Evolution of Securities Portfolio<br />
R$ million<br />
138,344 141,879<br />
136,248<br />
10,069 124,745 122,576 120,189 121,372 128,825 10,901<br />
17,605<br />
8,048<br />
7,901<br />
8,485 5,939 8,162<br />
30,024<br />
32,334<br />
43,621<br />
34,476<br />
41,436<br />
36,404 38,626 40,153<br />
25,774 27,998<br />
24,117<br />
28,180<br />
23,230 23,414<br />
13,888<br />
23,968<br />
27,432<br />
12,035<br />
9,440<br />
7,592<br />
9,447 8,319 7,993<br />
6,264<br />
52,907 51,958 48,664 45,011 43,889 41,097 45,791 51,585<br />
Derivative <strong>Financial</strong> Instruments<br />
PGBL/VGBL Fund Quotas<br />
Private Securities<br />
Public Securities – Foreign<br />
Public Securities – Domestic<br />
Dec/08 Mar/09 Jun/09 Sep/09 Dec/09 Mar/10 Jun/10 Sep/10<br />
Credit Portfolio by Risk Level<br />
At September 30, 2010, the share of credits rated "AA" to<br />
"C" grew by 30 basis points compared to the prior quarter,<br />
accounting for 90.4% of the portfolio. The increased share<br />
was a result of the overall improvement in the portfolio<br />
profile, attested by the growth in “AA” <strong>and</strong> “A” portfolios,<br />
by 8.7% <strong>and</strong> 7.2%, respectively. Such growth was basically<br />
driven by the reduced risks associated with the corporate<br />
segment. At the same time, the credit portfolio rated “D-H”<br />
continues to lose share since September of last year, as a<br />
result of the improved economic scenario <strong>and</strong> the<br />
introduction since the end of 2008 of more conservative<br />
credit policies.<br />
Evolution of Credit Portfolio by Risk Level<br />
27.8% 26.1% 21.7% 21.2% 21.0% 21.4% 21.9% 22.6%<br />
42.0% 41.2%<br />
43.3% 44.2% 45.1% 44.3% 44.7% 45.3%<br />
Dec/08 Mar/09 Jun/09 Sep/09 Dec/09 Mar/10 Jun/10 Sep/10<br />
AA<br />
A<br />
B<br />
C<br />
D-H<br />
Δ Balance<br />
Sep10 x<br />
Jun/10<br />
8.7%<br />
7.2%<br />
17.0%<br />
17.0% 17.8% 17.9% 17.7% 18.4% 18.2% 17.3% 0.4%<br />
5.2% 6.2% 6.4% 5.6% 5.8% 5.7% 5.3% 5.3% 5.5%<br />
8.0% 9.5% 10.8% 11.1% 10.5% 10.2% 9.9% 9.6% 0.0%<br />
20<br />
Management Discussion & Analysis 3 rd Quarter, 2010


