Monthly Bulletin April 2008 - European Central Bank - Europa
Monthly Bulletin April 2008 - European Central Bank - Europa
Monthly Bulletin April 2008 - European Central Bank - Europa
Create successful ePaper yourself
Turn your PDF publications into a flip-book with our unique Google optimized e-Paper software.
1), 2)<br />
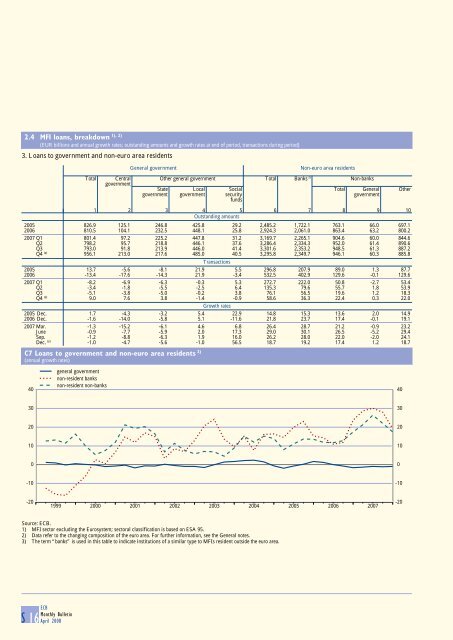
2.4 MFI loans, breakdown<br />
(EUR billions and annual growth rates; outstanding amounts and growth rates at end of period, transactions during period)<br />
3. Loans to government and non-euro area residents<br />
General government Non-euro area residents<br />
Total <strong>Central</strong> Other general government Total <strong>Bank</strong>s 3) Non-banks<br />
government<br />
State Local Social Total General Other<br />
government government security government<br />
funds<br />
1 2 3 4 5 6 7 8 9 10<br />
Outstanding amounts<br />
2005 826.9 125.1 246.8 425.8 29.2 2,485.2 1,722.1 763.1 66.0 697.1<br />
2006 810.5 104.1 232.5 448.1 25.8 2,924.3 2,061.0 863.4 63.2 800.2<br />
2007 Q1 801.4 97.2 225.2 447.8 31.2 3,169.7 2,265.1 904.6 60.0 844.6<br />
Q2 798.2 95.7 218.8 446.1 37.6 3,286.4 2,334.3 952.0 61.4 890.6<br />
Q3 793.0 91.8 213.9 446.0 41.4 3,301.6 2,353.2 948.5 61.3 887.2<br />
Q4 (p) 956.1 213.0 217.6 485.0 40.5 3,295.8 2,349.7 946.1 60.3 885.8<br />
Transactions<br />
2005 13.7 -5.6 -8.1 21.9 5.5 296.8 207.9 89.0 1.3 87.7<br />
2006 -13.4 -17.6 -14.3 21.9 -3.4 532.5 402.9 129.6 -0.1 129.6<br />
2007 Q1 -8.2 -6.9 -6.3 -0.3 5.3 272.7 222.0 50.8 -2.7 53.4<br />
Q2 -3.4 -1.8 -5.5 -2.5 6.4 135.3 79.6 55.7 1.8 53.9<br />
Q3 -5.1 -3.8 -5.0 -0.2 3.8 76.1 56.5 19.6 1.2 18.3<br />
Q4 (p) 9.0 7.6 3.8 -1.4 -0.9 58.6 36.3 22.4 0.3 22.0<br />
Growth rates<br />
2005 Dec. 1.7 -4.3 -3.2 5.4 22.9 14.8 15.3 13.6 2.0 14.9<br />
2006 Dec. -1.6 -14.0 -5.8 5.1 -11.6 21.8 23.7 17.4 -0.1 19.1<br />
2007 Mar. -1.3 -15.2 -6.1 4.6 6.8 26.4 28.7 21.2 -0.9 23.2<br />
June -0.9 -7.7 -5.9 2.0 17.3 29.0 30.1 26.5 -5.2 29.4<br />
Sep. -1.2 -8.8 -6.3 1.9 16.0 26.2 28.0 22.0 -2.0 24.1<br />
Dec. (p) -1.0 -4.7 -5.6 -1.0 56.5 18.7 19.2 17.4 1.2 18.7<br />
C7 Loans to government and non-euro area residents 2)<br />
(annual growth rates)<br />
40<br />
general government<br />
non-resident banks<br />
non-resident non-banks<br />
40<br />
30<br />
30<br />
20<br />
20<br />
10<br />
10<br />
0<br />
0<br />
-10<br />
-10<br />
-20<br />
1999 2000 2001 2002 2003 2004 2005 2006 2007<br />
-20<br />
Source: ECB.<br />
1) MFI sector excluding the Eurosystem; sectoral classification is based on ESA 95.<br />
2) Data refer to the changing composition of the euro area. For further information, see the General notes.<br />
3) The term ‘‘banks’’ is used in this table to indicate institutions of a similar type to MFIs resident outside the euro area.<br />
S 16 ECB<br />
<strong>Monthly</strong> <strong>Bulletin</strong><br />
<strong>April</strong> <strong>2008</strong>


