

Monthly Bulletin April 2008 - European Central Bank - Europa
Monthly Bulletin April 2008 - European Central Bank - Europa
Monthly Bulletin April 2008 - European Central Bank - Europa

Create successful ePaper yourself
Turn your PDF publications into a flip-book with our unique Google optimized e-Paper software.
ECONOMIC<br />
AND MONETARY<br />
DEVELOPMENTS<br />
Monetary and<br />
financial<br />
developments<br />
developments in household loans have been affected by the financial turmoil or that the supply of<br />
bank loans has been disrupted. The breakdown of household loans by purpose supports this view.<br />
The decline in the growth rate of loans to households reflects the moderation observed in the growth<br />
rate of loans for house purchase, which declined to 6.7% in February, down from 6.9% in January<br />
(see Table 2). This moderation was observed throughout the euro area and was particularly marked<br />
in countries that had previously experienced strong borrowing dynamics.<br />
The annual growth rate of MFI loans to non-financial corporations rose to 14.8% in February, up<br />
from 14.5% in the previous month. Overall, in the seven months from August 2007 to February <strong>2008</strong>,<br />
the total value of MFI loans to euro area non-financial corporations was €312 billion, compared<br />
with €328 billion in the seven months prior to the financial turmoil. This offers little indication<br />
that the supply of bank credit has been seriously hampered by the financial turmoil. Looking at the<br />
maturity breakdown, lending dynamics over this period were due mainly to stronger borrowing at<br />
medium to long maturities (i.e. lending with a maturity of over one year), which accounts for the<br />
bulk of loans to non-financial corporations. Thus, recent data provide no evidence of overall flows<br />
having increased as a result of banks experiencing difficulties in removing short-term bridge loans<br />
(related to LBOs and/or M&A deals) from their balance sheets. Overall, there continues to be no<br />
clear evidence of the turmoil having had an impact on the growth of MFI loans to the non-financial<br />
private sector.<br />
Among the other counterparts of M3, the annual growth rate of MFIs’ longer-term financial<br />
liabilities (excluding capital and reserves) fell to 6.4% in February, down from 7.7% in January.<br />
Although declines were observed in the annual growth rates of all sub-components, the strongest<br />
was observed for longer-term debt securities. Looking at the sectoral breakdown of longer-term<br />
deposits, the non-financial private sector continued to reduce its holdings of long-term deposits,<br />
which is to be expected in an environment characterised by a relatively flat yield curve. At the same<br />
time, the ongoing robust growth observed in non-monetary financial intermediaries’ holdings of<br />
long-term deposits may be related to securitisation activity.<br />
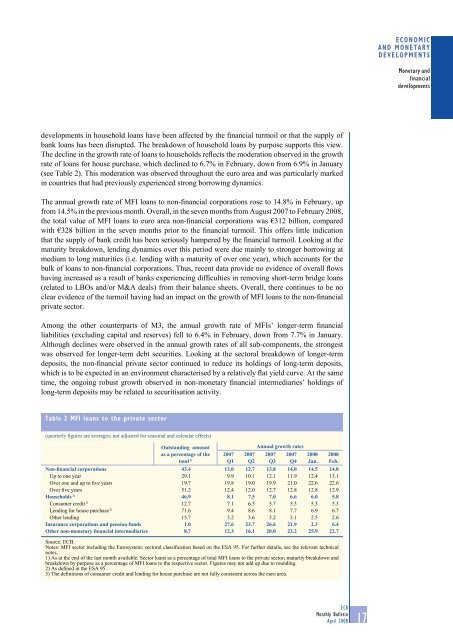
Table 2 MFI loans to the private sector<br />
(quarterly figures are averages; not adjusted for seasonal and calendar effects)<br />
Outstanding amount<br />
as a percentage of the<br />
total 1)<br />
Annual growth rates<br />
Non-financial corporations 43.4 13.0 12.7 13.8 14.0 14.5 14.8<br />
Up to one year 29.1 9.9 10.1 12.1 11.9 12.4 13.1<br />
Over one and up to five years 19.7 19.8 19.0 19.9 21.0 22.6 22.6<br />
Over five years 51.2 12.4 12.0 12.7 12.8 12.8 12.9<br />
Households 2) 46.9 8.1 7.5 7.0 6.6 6.0 5.8<br />
Consumer credit 3) 12.7 7.1 6.5 5.7 5.3 5.3 5.3<br />
Lending for house purchase 3) 71.6 9.4 8.6 8.1 7.7 6.9 6.7<br />
Other lending 15.7 3.2 3.6 3.2 3.1 2.5 2.6<br />
Insurance corporations and pension funds 1.0 27.6 23.7 26.6 21.9 2.3 6.4<br />
Other non-monetary financial intermediaries 8.7 12.3 16.1 20.0 23.2 25.9 22.7<br />
Source: ECB.<br />
Notes: MFI sector including the Eurosystem; sectoral classification based on the ESA 95. For further details, see the relevant technical<br />
notes.<br />
1) As at the end of the last month available. Sector loans as a percentage of total MFI loans to the private sector; maturity breakdown and<br />
breakdown by purpose as a percentage of MFI loans to the respective sector. Figures may not add up due to rounding.<br />
2) As defined in the ESA 95.<br />
3) The definitions of consumer credit and lending for house purchase are not fully consistent across the euro area.<br />
2007<br />
Q1<br />
2007<br />
Q2<br />
2007<br />
Q3<br />
2007<br />
Q4<br />
<strong>2008</strong><br />
Jan.<br />
<strong>2008</strong><br />
Feb.<br />
ECB<br />
<strong>Monthly</strong> <strong>Bulletin</strong><br />
<strong>April</strong> <strong>2008</strong><br />
17


