

Monthly Bulletin April 2008 - European Central Bank - Europa
Monthly Bulletin April 2008 - European Central Bank - Europa
Monthly Bulletin April 2008 - European Central Bank - Europa

Create successful ePaper yourself
Turn your PDF publications into a flip-book with our unique Google optimized e-Paper software.
EURO AREA<br />
STATISTICS<br />
External<br />
transactions<br />
and<br />
positions<br />
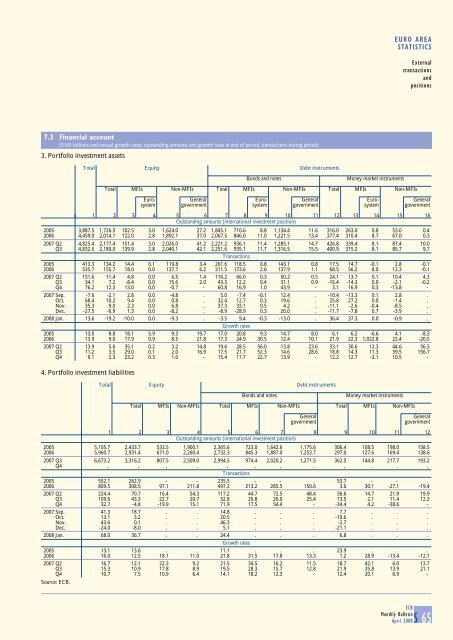
7.3 Financial account<br />
(EUR billions and annual growth rates; outstanding amounts and growth rates at end of period, transactions during period)<br />
3. Portfolio investment assets<br />
Total Equity Debt instruments<br />
Bonds and notes Money market instruments<br />
Total MFIs Non-MFIs Total MFIs Non-MFIs Total MFIs Non-MFIs<br />
Euro- General Euro- General Euro- General<br />
system government system government system government<br />
1 2 3 4 5 6 7 8 9 10 11 12 13 14 15 16<br />
Outstanding amounts (international investment position)<br />
2005 3,887.5 1,726.5 102.5 3.0 1,624.0 27.2 1,845.1 710.6 8.8 1,134.4 11.6 316.0 263.0 0.8 53.0 0.4<br />
2006 4,459.0 2,014.1 122.0 2.8 1,892.1 37.0 2,067.5 846.0 11.0 1,221.5 13.4 377.4 310.4 8.7 67.0 0.3<br />
2007 Q2 4,825.4 2,177.4 151.4 3.0 2,026.0 41.2 2,221.2 936.1 11.4 1,285.1 14.7 426.8 339.4 8.1 87.4 10.0<br />
Q3 4,832.5 2,180.0 139.9 2.8 2,040.1 42.1 2,251.6 935.1 11.7 1,316.5 15.5 400.9 315.2 8.1 85.7 9.7<br />
Transactions<br />
2005 413.3 134.2 14.4 0.1 119.8 3.4 261.6 118.5 0.8 143.1 0.8 17.5 14.7 -0.1 2.8 -0.1<br />
2006 535.7 155.7 18.0 0.0 137.7 6.2 311.5 173.6 2.6 137.9 1.1 68.5 56.2 8.0 12.3 -0.1<br />
2007 Q2 151.6 11.4 4.8 0.0 6.5 1.4 116.2 66.0 0.3 50.2 0.5 24.1 13.7 0.1 10.4 4.3<br />
Q3 34.1 7.2 -8.4 0.0 15.6 2.0 43.3 12.2 0.4 31.1 0.9 -16.4 -14.3 0.0 -2.1 -0.2<br />
Q4 76.2 12.3 13.0 0.0 -0.7 - 60.8 16.9 1.0 43.9 - 3.1 16.9 0.3 -13.8 -<br />
2007 Sep. -7.6 -2.1 2.8 0.0 -4.8 . 5.0 -7.4 -0.1 12.4 . -10.4 -13.3 0.1 2.8 .<br />
Oct. 68.4 10.2 9.4 0.0 0.8 . 32.4 12.7 0.3 19.6 . 25.8 27.2 0.0 -1.4 .<br />
Nov. 35.3 9.0 2.3 0.0 6.8 . 37.3 33.1 0.5 4.2 . -11.1 -2.6 -0.4 -8.5 .<br />
Dec. -27.5 -6.9 1.3 0.0 -8.2 . -8.9 -28.9 0.3 20.0 . -11.7 -7.8 0.7 -3.9 .<br />
<strong>2008</strong> Jan. 13.6 -19.2 -10.0 0.0 -9.3 . -3.5 9.4 -0.3 -13.0 . 36.4 37.3 0.0 -0.9 .<br />
Growth rates<br />
2005 13.0 9.8 18.1 5.9 9.3 19.7 17.0 20.8 9.3 14.7 8.0 6.1 6.2 -6.6 4.1 -8.3<br />
2006 13.9 9.0 17.9 0.9 8.5 21.8 17.3 24.9 30.5 12.4 10.1 21.9 22.3 1,022.8 22.4 -20.5<br />
2007 Q2 13.9 5.0 35.1 0.2 3.2 14.8 19.6 28.5 56.0 13.8 23.6 33.1 30.6 12.3 44.6 56.5<br />
Q3 11.2 3.5 29.0 0.1 2.0 16.9 17.5 21.7 52.3 14.6 28.6 18.8 14.3 11.3 39.5 156.7<br />
Q4 9.1 2.3 23.2 0.3 1.0 - 15.4 17.7 22.7 13.9 - 12.2 12.7 -3.1 10.5 -<br />
4. Portfolio investment liabilities<br />
Total Equity Debt instruments<br />
Bonds and notes Money market instruments<br />
Total MFIs Non-MFIs Total MFIs Non-MFIs Total MFIs Non-MFIs<br />
General<br />
government<br />
General<br />
government<br />
1 2 3 4 5 6 7 8 9 10 11 12<br />
Outstanding amounts (international investment position)<br />
2005 5,105.7 2,433.7 533.5 1,900.1 2,365.6 723.0 1,642.6 1,175.6 306.4 108.5 198.0 158.5<br />
2006 5,960.7 2,931.4 671.0 2,260.4 2,732.3 845.3 1,887.0 1,253.7 297.0 127.6 169.4 138.6<br />
2007 Q3 6,673.2 3,316.2 807.5 2,509.0 2,994.5 974.4 2,020.2 1,271.5 362.5 144.8 217.7 193.2<br />
Q4 . . . . . . . . . . . .<br />
Transactions<br />
2005 552.1 262.9 - - 235.5 - - . 53.7 - - .<br />
2006 809.5 308.5 97.1 211.8 497.3 213.2 285.5 150.6 3.6 30.1 -27.1 -19.4<br />
2007 Q2 224.4 70.7 16.4 54.3 117.2 44.7 72.5 48.4 36.6 14.7 21.9 19.9<br />
Q3 109.6 43.3 22.7 20.7 52.8 26.8 26.0 25.4 13.5 2.1 11.4 12.2<br />
Q4 32.7 -4.8 -19.9 15.1 71.9 17.5 54.4 - -34.4 4.2 -38.6 -<br />
2007 Sep. 41.3 18.7 . . 14.8 . . . 7.7 . . .<br />
Oct. 13.1 3.2 . . 20.5 . . . -10.6 . . .<br />
Nov. 43.6 0.1 . . 46.3 . . . -2.7 . . .<br />
Dec. -24.0 -8.0 . . 5.1 . . . -21.1 . . .<br />
<strong>2008</strong> Jan. 68.0 36.7 . . 24.4 . . . 6.8 . . .<br />
Growth rates<br />
2005 13.1 13.6 . . 11.1 . . . 23.9 . . .<br />
2006 16.0 12.5 18.1 11.0 21.8 31.5 17.8 13.3 1.2 28.9 -13.4 -12.1<br />
2007 Q2 16.7 12.1 22.3 9.2 21.5 34.5 16.2 11.5 18.7 42.1 6.0 13.7<br />
Q3 15.3 10.9 17.8 8.9 19.5 28.3 15.7 12.8 21.9 35.8 13.9 21.1<br />
Q4 10.7 7.5 10.9 6.4 14.1 18.2 12.3 - 12.4 20.1 6.9 -<br />
Source: ECB.<br />
ECB<br />
<strong>Monthly</strong> <strong>Bulletin</strong><br />
<strong>April</strong> <strong>2008</strong>S 65


