

Monthly Bulletin April 2008 - European Central Bank - Europa
Monthly Bulletin April 2008 - European Central Bank - Europa
Monthly Bulletin April 2008 - European Central Bank - Europa

You also want an ePaper? Increase the reach of your titles
YUMPU automatically turns print PDFs into web optimized ePapers that Google loves.
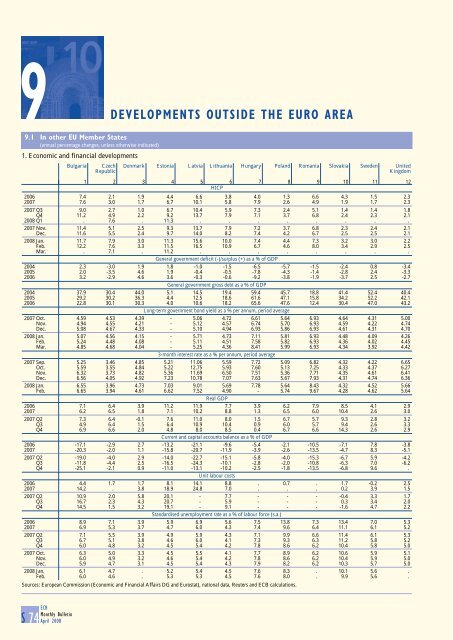
9 DEVELOPMENTS<br />
9.1 In other EU Member States<br />
(annual percentage changes, unless otherwise indicated)<br />
1. Economic and financial developments<br />
S 74 ECB<br />
<strong>Monthly</strong> <strong>Bulletin</strong><br />
<strong>April</strong> <strong>2008</strong><br />
OUTSIDE THE EURO AREA<br />
Bulgaria Czech Denmark Estonia Latvia Lithuania Hungary Poland Romania Slovakia Sweden United<br />
Republic<br />
Kingdom<br />
1 2 3 4 5 6 7 8 9 10 11 12<br />
HICP<br />
2006 7.4 2.1 1.9 4.4 6.6 3.8 4.0 1.3 6.6 4.3 1.5 2.3<br />
2007 7.6 3.0 1.7 6.7 10.1 5.8 7.9 2.6 4.9 1.9 1.7 2.3<br />
2007 Q3 9.0 2.7 1.0 6.7 10.4 5.9 7.3 2.4 5.1 1.4 1.4 1.8<br />
Q4 11.2 4.9 2.2 9.2 13.7 7.9 7.1 3.7 6.8 2.4 2.3 2.1<br />
<strong>2008</strong> Q1 . 7.6 . 11.3 . . . . . . . .<br />
2007 Nov. 11.4 5.1 2.5 9.3 13.7 7.9 7.2 3.7 6.8 2.3 2.4 2.1<br />
Dec. 11.6 5.5 2.4 9.7 14.0 8.2 7.4 4.2 6.7 2.5 2.5 2.1<br />
<strong>2008</strong> Jan. 11.7 7.9 3.0 11.3 15.6 10.0 7.4 4.4 7.3 3.2 3.0 2.2<br />
Feb. 12.2 7.6 3.3 11.5 16.5 10.9 6.7 4.6 8.0 3.4 2.9 2.5<br />
Mar. . 7.1 . 11.2 . . . . . . . .<br />
General government deficit (-)/surplus (+) as a % of GDP<br />
2004 2.3 -3.0 1.9 1.8 -1.0 -1.5 -6.5 -5.7 -1.5 -2.4 0.8 -3.4<br />
2005 2.0 -3.5 4.6 1.9 -0.4 -0.5 -7.8 -4.3 -1.4 -2.8 2.4 -3.3<br />
2006 3.2 -2.9 4.6 3.6 -0.3 -0.6 -9.2 -3.8 -1.9 -3.7 2.5 -2.7<br />
General government gross debt as a % of GDP<br />
2004 37.9 30.4 44.0 5.1 14.5 19.4 59.4 45.7 18.8 41.4 52.4 40.4<br />
2005 29.2 30.2 36.3 4.4 12.5 18.6 61.6 47.1 15.8 34.2 52.2 42.1<br />
2006 22.8 30.1 30.3 4.0 10.6 18.2 65.6 47.6 12.4 30.4 47.0 43.2<br />
Long-term government bond yield as a % per annum, period average<br />
2007 Oct. 4.59 4.53 4.39 - 5.06 4.72 6.61 5.64 6.93 4.64 4.31 5.00<br />
Nov. 4.94 4.55 4.21 - 5.12 4.57 6.74 5.70 6.93 4.59 4.22 4.74<br />
Dec. 5.08 4.67 4.33 - 5.10 4.94 6.93 5.86 6.93 4.61 4.31 4.70<br />
<strong>2008</strong> Jan. 5.07 4.56 4.15 - 5.71 4.73 7.11 5.81 6.93 4.48 4.09 4.26<br />
Feb. 5.24 4.48 4.08 - 5.11 4.51 7.58 5.82 6.93 4.36 4.02 4.45<br />
Mar. 4.85 4.68 4.04 - 5.25 4.36 8.41 5.99 6.93 4.34 3.92 4.42<br />
3-month interest rate as a % per annum, period average<br />
2007 Sep. 5.25 3.46 4.85 5.21 11.06 5.59 7.72 5.09 6.82 4.32 4.22 6.65<br />
Oct. 5.59 3.55 4.84 5.22 12.75 5.93 7.60 5.13 7.25 4.33 4.37 6.27<br />
Nov. 6.32 3.73 4.82 5.36 11.69 6.50 7.51 5.36 7.71 4.35 4.61 6.41<br />
Dec. 6.56 4.05 4.92 7.23 10.78 7.07 7.63 5.67 7.93 4.31 4.74 6.36<br />
<strong>2008</strong> Jan. 6.55 3.96 4.73 7.03 9.01 5.69 7.78 5.64 8.43 4.32 4.52 5.66<br />
Feb. 6.65 3.94 4.61 6.62 7.52 4.90 - 5.74 9.67 4.28 4.62 5.64<br />
Real GDP<br />
2006 7.1 6.4 3.9 11.2 11.9 7.7 3.9 6.2 7.9 8.5 4.1 2.9<br />
2007 6.2 6.5 1.8 7.1 10.2 8.8 1.3 6.5 6.0 10.4 2.6 3.0<br />
2007 Q2 7.3 6.4 -0.1 7.6 11.0 8.0 1.5 6.7 5.7 9.3 2.8 3.2<br />
Q3 4.9 6.4 1.5 6.4 10.9 10.4 0.9 6.0 5.7 9.4 2.6 3.3<br />
Q4 6.9 6.6 2.0 4.8 8.0 8.5 0.4 6.7 6.6 14.3 2.6 2.9<br />
Current and capital accounts balance as a % of GDP<br />
2006 -17.1 -2.9 2.7 -13.2 -21.1 -9.6 -5.4 -2.1 -10.5 -7.1 7.8 -3.8<br />
2007 -20.3 -2.0 1.1 -15.8 -20.7 -11.9 -3.9 -2.6 -13.5 -4.7 8.3 -5.1<br />
2007 Q2 -19.0 -4.0 2.9 -14.0 -22.7 -15.1 -5.8 -4.0 -15.3 -6.7 5.9 -4.2<br />
Q3 -11.8 -4.4 2.5 -16.5 -24.3 -10.1 -2.8 -2.0 -10.8 -6.3 7.0 -6.2<br />
Q4 -25.1 -2.1 0.9 -11.0 -13.1 -10.2 -2.5 -1.8 -13.5 -6.8 9.6 .<br />
Unit labour costs<br />
2006 4.4 1.7 1.7 8.1 14.1 8.8 . 0.7 . 1.7 -0.2 2.5<br />
2007 14.2 . 3.8 18.9 24.8 7.0 . . . 0.2 3.9 1.5<br />
2007 Q2 10.9 2.0 5.8 20.1 - 7.7 - - - -0.4 3.3 1.7<br />
Q3 16.7 2.3 4.3 20.7 - 5.9 - - - 0.3 3.4 2.0<br />
Q4 14.5 1.5 3.2 19.1 - 9.1 - - - -1.6 4.7 2.2<br />
Standardised unemployment rate as a % of labour force (s.a.)<br />
2006 8.9 7.1 3.9 5.9 6.9 5.6 7.5 13.8 7.3 13.4 7.0 5.3<br />
2007 6.9 5.3 3.7 4.7 6.0 4.3 7.4 9.6 6.4 11.1 6.1 5.2<br />
2007 Q2 7.1 5.5 3.9 4.9 5.9 4.3 7.1 9.9 6.6 11.4 6.1 5.3<br />
Q3 6.7 5.1 3.8 4.6 6.0 4.1 7.3 9.3 6.3 11.2 5.8 5.2<br />
Q4 6.0 4.8 3.2 4.5 5.4 4.2 7.8 8.6 6.2 10.4 5.8 5.0<br />
2007 Oct. 6.3 5.0 3.3 4.5 5.5 4.1 7.7 8.9 6.2 10.6 5.9 5.1<br />
Nov. 6.0 4.9 3.2 4.6 5.4 4.2 7.8 8.6 6.2 10.4 5.9 5.0<br />
Dec. 5.9 4.7 3.1 4.5 5.4 4.3 7.9 8.2 6.2 10.3 5.7 5.0<br />
<strong>2008</strong> Jan. 6.1 4.7 . 5.2 5.4 4.5 7.6 8.3 . 10.1 5.6 .<br />
Feb. 6.0 4.6 . 5.3 5.3 4.5 7.6 8.0 . 9.9 5.6 .<br />
Sources: <strong>European</strong> Commission (Economic and Financial Affairs DG and Eurostat), national data, Reuters and ECB calculations.


