

Monthly Bulletin April 2008 - European Central Bank - Europa
Monthly Bulletin April 2008 - European Central Bank - Europa
Monthly Bulletin April 2008 - European Central Bank - Europa

You also want an ePaper? Increase the reach of your titles
YUMPU automatically turns print PDFs into web optimized ePapers that Google loves.
1), 2)<br />
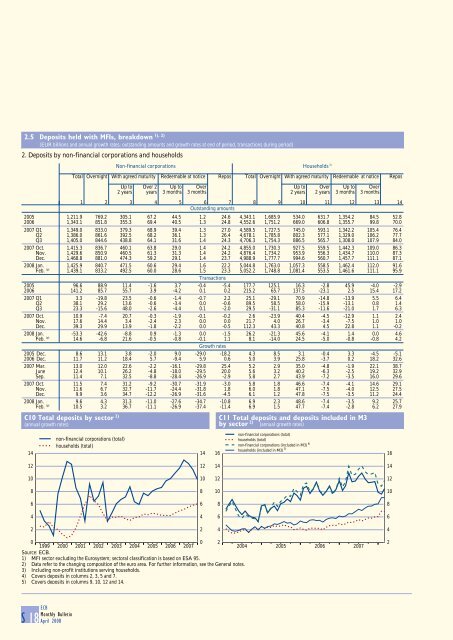
2.5 Deposits held with MFIs, breakdown<br />
(EUR billions and annual growth rates; outstanding amounts and growth rates at end of period, transactions during period)<br />
2. Deposits by non-financial corporations and households<br />
Non-financial corporations Households 3)<br />
Total Overnight With agreed maturity Redeemable at notice Repos Total Overnight With agreed maturity Redeemable at notice Repos<br />
Up to Over 2 Up to Over Up to Over Up to Over<br />
2 years years 3 months 3 months 2 years 2 years 3 months 3 months<br />
1 2 3 4 5 6 7 8 9 10 11 12 13 14<br />
Outstanding amounts<br />
2005 1,211.9 769.2 305.1 67.2 44.5 1.2 24.6 4,343.1 1,685.9 534.0 631.7 1,354.2 84.5 52.8<br />
2006 1,343.1 851.8 355.3 69.4 40.5 1.3 24.8 4,552.6 1,751.2 669.0 606.8 1,355.7 99.8 70.0<br />
2007 Q1 1,349.0 833.0 379.3 68.9 39.4 1.3 27.0 4,589.5 1,727.5 745.0 593.1 1,342.2 105.4 76.4<br />
Q2 1,386.0 861.6 392.5 68.2 36.1 1.3 26.4 4,678.1 1,785.8 802.3 577.1 1,329.0 106.2 77.7<br />
Q3 1,405.0 844.6 438.8 64.1 31.6 1.4 24.3 4,706.3 1,754.3 886.5 565.7 1,308.0 107.9 84.0<br />
2007 Oct. 1,415.3 836.7 460.1 63.8 29.0 1.4 24.2 4,855.0 1,730.3 927.5 559.5 1,442.3 109.0 86.3<br />
Nov. 1,429.6 850.9 460.5 61.3 31.3 1.4 24.2 4,876.4 1,734.2 953.9 556.3 1,434.7 110.0 87.3<br />
Dec. 1,468.8 881.0 474.3 59.2 29.1 1.4 23.7 4,988.9 1,777.7 994.6 560.7 1,457.7 111.1 87.1<br />
<strong>2008</strong> Jan. 1,425.9 840.7 471.5 60.6 29.4 1.6 22.2 5,044.8 1,763.0 1,057.3 558.5 1,462.4 112.0 91.6<br />
Feb. (p) 1,439.1 833.2 492.5 60.0 28.6 1.5 23.3 5,052.2 1,748.8 1,081.4 553.5 1,461.6 111.1 95.9<br />
Transactions<br />
2005 96.6 88.9 11.4 -1.6 3.7 -0.4 -5.4 177.7 125.1 16.3 -2.8 45.9 -4.0 -2.9<br />
2006 141.2 85.7 55.7 3.9 -4.2 0.1 0.2 215.2 65.7 137.5 -23.1 2.5 15.4 17.2<br />
2007 Q1 3.3 -19.8 23.5 -0.6 -1.4 -0.7 2.2 25.1 -29.1 70.9 -14.8 -13.9 5.5 6.4<br />
Q2 38.1 29.2 13.6 -0.6 -3.4 0.0 -0.6 89.5 58.5 58.0 -15.9 -13.1 0.8 1.4<br />
Q3 23.3 -15.6 48.0 -2.6 -4.4 0.1 -2.0 29.5 -31.1 85.3 -11.6 -21.0 1.7 6.3<br />
2007 Oct. 10.9 -7.4 20.7 -0.3 -1.9 -0.1 -0.2 2.6 -23.9 40.4 -4.5 -12.9 1.1 2.4<br />
Nov. 17.6 14.4 3.4 -2.4 2.3 0.0 0.0 21.7 4.0 26.7 -3.4 -7.5 1.0 1.0<br />
Dec. 39.3 29.9 13.9 -1.8 -2.2 0.0 -0.5 112.3 43.3 40.8 4.5 22.8 1.1 -0.2<br />
<strong>2008</strong> Jan. -53.3 -42.6 -8.8 0.9 -1.3 0.0 -1.5 26.2 -21.3 45.6 -4.1 1.4 0.0 4.6<br />
Feb. (p) 14.6 -6.8 21.6 -0.5 -0.8 -0.1 1.1 8.1 -14.0 24.5 -5.0 -0.8 -0.8 4.2<br />
Growth rates<br />
2005 Dec. 8.6 13.1 3.8 -2.0 9.0 -29.0 -18.2 4.3 8.5 3.1 -0.4 3.3 -4.5 -5.1<br />
2006 Dec. 11.7 11.2 18.4 5.7 -9.4 5.9 0.6 5.0 3.9 25.8 -3.7 0.2 18.2 32.6<br />
2007 Mar. 13.0 12.0 22.6 -2.2 -16.1 -29.8 25.4 5.2 2.9 35.0 -4.8 -1.9 22.1 38.7<br />
June 12.4 10.1 26.2 -4.8 -18.0 -29.5 20.0 5.6 3.2 40.2 -6.3 -2.5 19.2 32.9<br />
Sep. 11.4 7.1 32.5 -8.8 -28.4 -26.9 -2.9 5.8 2.7 43.9 -7.2 -3.5 16.0 29.6<br />
2007 Oct. 11.5 7.4 31.2 -9.2 -30.7 -31.9 -3.0 5.8 1.8 46.6 -7.4 -4.1 14.6 29.1<br />
Nov. 11.6 6.7 32.7 -11.7 -24.4 -31.8 1.8 6.0 1.8 47.1 -7.5 -4.0 12.5 27.5<br />
Dec. 9.9 3.6 34.7 -12.2 -26.9 -31.6 -4.5 6.1 1.2 47.8 -7.5 -3.5 11.2 24.4<br />
<strong>2008</strong> Jan. 9.6 4.3 31.3 -11.0 -27.6 -34.7 -10.8 6.9 2.3 48.6 -7.4 -3.5 9.2 25.7<br />
Feb. (p) 10.5 3.2 36.7 -11.1 -26.9 -37.4 -11.4 6.9 1.5 47.7 -7.4 -2.8 6.2 27.9<br />
C10 Total deposits by sector 2)<br />
(annual growth rates)<br />
C11 Total deposits and deposits included in M3<br />
by sector 2) (annual growth rates)<br />
14<br />
non-financial corporations (total)<br />
households (total)<br />
14<br />
16<br />
non-financial corporations (total)<br />
households (total)<br />
4)<br />
non-financial corporations (included in M3)<br />
5)<br />
households (included in M3)<br />
16<br />
12<br />
12<br />
14<br />
14<br />
10<br />
10<br />
12<br />
12<br />
8<br />
8<br />
10<br />
10<br />
6<br />
6<br />
8<br />
8<br />
4<br />
4<br />
6<br />
6<br />
2<br />
2<br />
4<br />
4<br />
0<br />
1999 2000 2001 2002 2003 2004 2005 2006 2007<br />
0 2<br />
2004 2005 2006 2007<br />
Source: ECB.<br />
1) MFI sector excluding the Eurosystem; sectoral classification is based on ESA 95.<br />
2) Data refer to the changing composition of the euro area. For further information, see the General notes.<br />
3) Including non-profit institutions serving households.<br />
4) Covers deposits in columns 2, 3, 5 and 7.<br />
5) Covers deposits in columns 9, 10, 12 and 14.<br />
2<br />
S 18 ECB<br />
<strong>Monthly</strong> <strong>Bulletin</strong><br />
<strong>April</strong> <strong>2008</strong>


