

Monthly Bulletin April 2008 - European Central Bank - Europa
Monthly Bulletin April 2008 - European Central Bank - Europa
Monthly Bulletin April 2008 - European Central Bank - Europa

You also want an ePaper? Increase the reach of your titles
YUMPU automatically turns print PDFs into web optimized ePapers that Google loves.
3 EURO<br />
AREA ACCOUNTS<br />
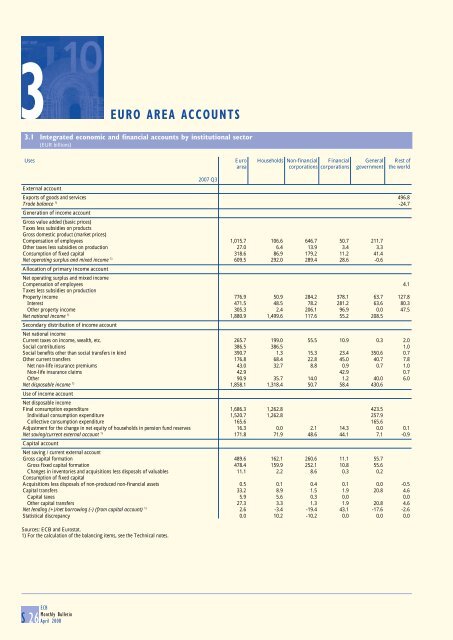
3.1 Integrated economic and financial accounts by institutional sector<br />
(EUR billions)<br />
Uses Euro Households Non-financial Financial General Rest of<br />
area corporations corporations government the world<br />
2007 Q3<br />
External account<br />
Exports of goods and services 496.8<br />
Trade balance 1) -24.7<br />
Generation of income account<br />
Gross value added (basic prices)<br />
Taxes less subsidies on products<br />
Gross domestic product (market prices)<br />
Compensation of employees 1,015.7 106.6 646.7 50.7 211.7<br />
Other taxes less subsidies on production 27.0 6.4 13.9 3.4 3.3<br />
Consumption of fixed capital 318.6 86.9 179.2 11.2 41.4<br />
Net operating surplus and mixed income 1) 609.5 292.0 289.4 28.6 -0.6<br />
Allocation of primary income account<br />
Net operating surplus and mixed income<br />
Compensation of employees 4.1<br />
Taxes less subsidies on production<br />
Property income 776.9 50.9 284.2 378.1 63.7 127.8<br />
Interest 471.5 48.5 78.2 281.2 63.6 80.3<br />
Other property income 305.3 2.4 206.1 96.9 0.0 47.5<br />
Net national income 1) 1,880.9 1,499.6 117.6 55.2 208.5<br />
Secondary distribution of income account<br />
Net national income<br />
Current taxes on income, wealth, etc. 265.7 199.0 55.5 10.9 0.3 2.0<br />
Social contributions 386.5 386.5 1.0<br />
Social benefits other than social transfers in kind 390.7 1.3 15.3 23.4 350.6 0.7<br />
Other current transfers 176.8 68.4 22.8 45.0 40.7 7.8<br />
Net non-life insurance premiums 43.0 32.7 8.8 0.9 0.7 1.0<br />
Non-life insurance claims 42.9 42.9 0.7<br />
Other 90.9 35.7 14.0 1.2 40.0 6.0<br />
Net disposable income 1) 1,858.1 1,318.4 50.7 58.4 430.6<br />
Use of income account<br />
Net disposable income<br />
Final consumption expenditure 1,686.3 1,262.8 423.5<br />
Individual consumption expenditure 1,520.7 1,262.8 257.9<br />
Collective consumption expenditure 165.6 165.6<br />
Adjustment for the change in net equity of households in pension fund reserves 16.3 0.0 2.1 14.3 0.0 0.1<br />
Net saving/current external account 1) 171.8 71.9 48.6 44.1 7.1 -0.9<br />
Capital account<br />
Net saving / current external account<br />
Gross capital formation 489.6 162.1 260.6 11.1 55.7<br />
Gross fixed capital formation 478.4 159.9 252.1 10.8 55.6<br />
Changes in inventories and acquisitions less disposals of valuables 11.1 2.2 8.6 0.3 0.2<br />
Consumption of fixed capital<br />
Acquisitions less disposals of non-produced non-financial assets 0.5 0.1 0.4 0.1 0.0 -0.5<br />
Capital transfers 33.2 8.9 1.5 1.9 20.8 4.6<br />
Capital taxes 5.9 5.6 0.3 0.0 0.0<br />
Other capital transfers 27.3 3.3 1.3 1.9 20.8 4.6<br />
Net lending (+)/net borrowing (-) (from capital account) 1) 2.6 -3.4 -19.4 43.1 -17.6 -2.6<br />
Statistical discrepancy 0.0 10.2 -10.2 0.0 0.0 0.0<br />
Sources: ECB and Eurostat.<br />
1) For the calculation of the balancing items, see the Technical notes.<br />
S 26 ECB<br />
<strong>Monthly</strong> <strong>Bulletin</strong><br />
<strong>April</strong> <strong>2008</strong>


