

Monthly Bulletin April 2008 - European Central Bank - Europa
Monthly Bulletin April 2008 - European Central Bank - Europa
Monthly Bulletin April 2008 - European Central Bank - Europa

You also want an ePaper? Increase the reach of your titles
YUMPU automatically turns print PDFs into web optimized ePapers that Google loves.
EURO AREA<br />
STATISTICS<br />
Euro area<br />
accounts<br />
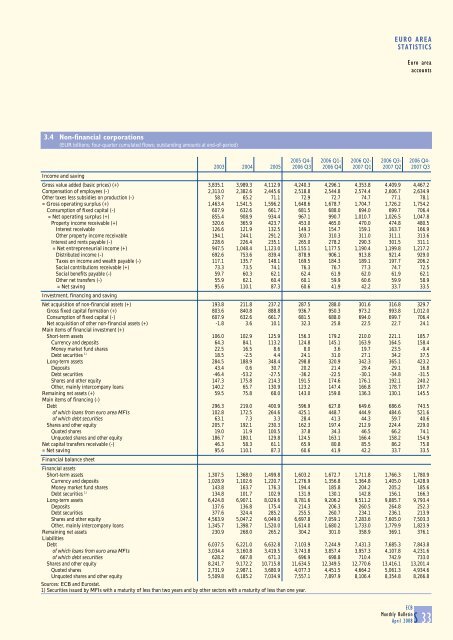
3.4 Non-financial corporations<br />
(EUR billions; four-quarter cumulated flows; outstanding amounts at end-of-period)<br />
Income and saving<br />
2005 Q4- 2006 Q1- 2006 Q2- 2006 Q3- 2006 Q4-<br />
2003 2004 2005 2006 Q3 2006 Q4 2007 Q1 2007 Q2 2007 Q3<br />
Gross value added (basic prices) (+) 3,835.1 3,989.3 4,112.9 4,240.3 4,296.1 4,353.8 4,409.9 4,467.2<br />
Compensation of employees (-) 2,313.0 2,382.6 2,445.6 2,518.8 2,544.8 2,574.4 2,606.7 2,634.9<br />
Other taxes less subsidies on production (-) 58.7 65.2 71.1 72.9 72.7 74.7 77.1 78.1<br />
= Gross operating surplus (+) 1,463.4 1,541.5 1,596.2 1,648.6 1,678.7 1,704.7 1,726.2 1,754.2<br />
Consumption of fixed capital (-) 607.9 632.6 661.7 681.5 688.0 694.0 699.7 706.4<br />
= Net operating surplus (+) 855.4 908.9 934.4 967.1 990.7 1,010.7 1,026.5 1,047.8<br />
Property income receivable (+) 320.6 365.9 423.7 453.0 465.0 470.0 474.8 480.5<br />
Interest receivable 126.6 121.9 132.5 149.3 154.7 159.1 163.7 166.9<br />
Other property income receivable 194.1 244.1 291.2 303.7 310.3 311.0 311.1 313.6<br />
Interest and rents payable (-) 228.6 226.4 235.1 265.0 278.2 290.3 301.5 311.1<br />
= Net entrepreneurial income (+) 947.5 1,048.4 1,123.0 1,155.1 1,177.5 1,190.4 1,199.8 1,217.2<br />
Distributed income (-) 692.6 753.6 839.4 878.9 906.1 913.8 921.4 929.0<br />
Taxes on income and wealth payable (-) 117.1 135.7 148.1 169.5 184.3 189.1 197.7 206.2<br />
Social contributions receivable (+) 73.3 73.5 74.1 76.3 76.7 77.3 74.7 72.5<br />
Social benefits payable (-) 59.7 60.3 62.1 62.4 61.9 62.0 61.9 62.1<br />
Other net transfers (-) 55.9 62.1 60.4 60.1 59.9 60.6 59.9 58.9<br />
= Net saving 95.6 110.1 87.3 60.6 41.9 42.2 33.7 33.5<br />
Investment, financing and saving<br />
Net acquisition of non-financial assets (+) 193.8 211.8 237.2 287.5 288.0 301.6 316.8 329.7<br />
Gross fixed capital formation (+) 803.6 840.8 888.8 936.7 950.3 973.2 993.8 1,012.0<br />
Consumption of fixed capital (-) 607.9 632.6 661.7 681.5 688.0 694.0 699.7 706.4<br />
Net acquisition of other non-financial assets (+) -1.8 3.6 10.1 32.3 25.8 22.5 22.7 24.1<br />
Main items of financial investment (+)<br />
Short-term assets 106.0 102.9 125.9 156.3 179.2 210.0 221.1 185.7<br />
Currency and deposits 64.3 84.1 113.2 124.8 145.1 163.9 164.5 158.4<br />
Money market fund shares 22.5 16.5 8.6 8.0 3.6 19.7 23.5 -9.4<br />
Debt securities 1) 18.5 -2.5 4.4 24.1 31.0 27.1 34.2 37.5<br />
Long-term assets 284.5 188.9 348.4 298.8 320.9 342.3 365.1 423.2<br />
Deposits 43.4 0.6 30.7 20.2 21.4 29.4 29.1 16.8<br />
Debt securities -46.4 -53.2 -27.5 -36.2 -22.5 -30.1 -34.8 -31.5<br />
Shares and other equity 147.3 175.8 214.3 191.5 174.6 176.1 192.1 240.2<br />
Other, mainly intercompany loans 140.2 65.7 130.9 123.2 147.4 166.8 178.7 197.7<br />
Remaining net assets (+) 59.5 75.8 68.0 143.0 159.8 136.3 130.1 145.5<br />
Main items of financing (-)<br />
Debt 296.3 219.0 400.9 596.9 627.8 649.6 686.6 743.5<br />
of which loans from euro area MFIs 102.8 172.5 264.6 425.1 448.7 444.9 484.6 521.6<br />
of which debt securities 63.1 7.3 3.3 28.4 41.3 44.3 59.7 40.6<br />
Shares and other equity 205.7 192.1 230.3 162.3 197.4 212.9 224.4 229.0<br />
Quoted shares 19.0 11.9 100.5 37.8 34.3 46.5 66.2 74.1<br />
Unquoted shares and other equity 186.7 180.1 129.8 124.5 163.1 166.4 158.2 154.9<br />
Net capital transfers receivable (-) 46.3 58.3 61.1 65.9 80.8 85.5 86.2 75.8<br />
= Net saving 95.6 110.1 87.3 60.6 41.9 42.2 33.7 33.5<br />
Financial balance sheet<br />
Financial assets<br />
Short-term assets 1,307.5 1,368.0 1,499.8 1,603.2 1,672.7 1,711.8 1,766.3 1,780.9<br />
Currency and deposits 1,028.9 1,102.6 1,220.7 1,276.9 1,356.8 1,364.8 1,405.0 1,428.9<br />
Money market fund shares 143.8 163.7 176.3 194.4 185.8 204.2 205.2 185.6<br />
Debt securities 1) 134.8 101.7 102.9 131.9 130.1 142.8 156.1 166.3<br />
Long-term assets 6,424.8 6,907.1 8,029.6 8,781.6 9,206.2 9,511.2 9,885.7 9,793.4<br />
Deposits 137.6 136.8 175.4 214.3 206.3 260.5 264.8 252.3<br />
Debt securities 377.6 324.4 285.2 255.5 260.7 234.1 236.1 213.9<br />
Shares and other equity 4,563.9 5,047.2 6,049.0 6,697.8 7,059.1 7,283.6 7,605.0 7,503.3<br />
Other, mainly intercompany loans 1,345.7 1,398.7 1,520.0 1,614.0 1,680.2 1,733.0 1,779.9 1,823.9<br />
Remaining net assets 230.9 268.0 265.2 304.2 301.0 358.9 369.1 376.1<br />
Liabilities<br />
Debt 6,037.5 6,221.0 6,632.8 7,103.9 7,244.9 7,431.3 7,685.3 7,843.8<br />
of which loans from euro area MFIs 3,034.4 3,160.8 3,419.5 3,743.8 3,857.4 3,957.3 4,107.8 4,231.6<br />
of which debt securities 628.2 667.8 671.3 696.9 698.8 710.4 742.9 733.0<br />
Shares and other equity 8,241.7 9,172.2 10,715.8 11,634.5 12,349.5 12,770.6 13,416.1 13,201.4<br />
Quoted shares 2,731.9 2,987.1 3,680.9 4,077.3 4,451.5 4,664.2 5,061.3 4,934.6<br />
Unquoted shares and other equity 5,509.8 6,185.2 7,034.9 7,557.1 7,897.9 8,106.4 8,354.8 8,266.8<br />
Sources: ECB and Eurostat.<br />
1) Securities issued by MFIs with a maturity of less than two years and by other sectors with a maturity of less than one year.<br />
ECB<br />
<strong>Monthly</strong> <strong>Bulletin</strong><br />
<strong>April</strong> <strong>2008</strong>S 33


