

Monthly Bulletin April 2008 - European Central Bank - Europa
Monthly Bulletin April 2008 - European Central Bank - Europa
Monthly Bulletin April 2008 - European Central Bank - Europa

Create successful ePaper yourself
Turn your PDF publications into a flip-book with our unique Google optimized e-Paper software.
February, after having increased by an average<br />
monthly rate of 1.4% over the period from<br />
May 2007 to January <strong>2008</strong>. Despite this<br />
moderation in short-term movements, past<br />
developments still imply significant accumulated<br />
pipeline pressures which have not yet reached<br />
the consumer level. In particular, these pressures<br />
could have a further impact on the consumer<br />
prices charged by food-related service providers.<br />
By contrast, the annual rate of change in producer<br />
prices for consumer goods excluding tobacco and<br />
food prices continued in February to move around<br />
the moderate level observed since the beginning<br />
of last year. Thus there is so far no evidence of an<br />
increase in pipeline pressures on consumer prices<br />
for non-energy industrial goods.<br />
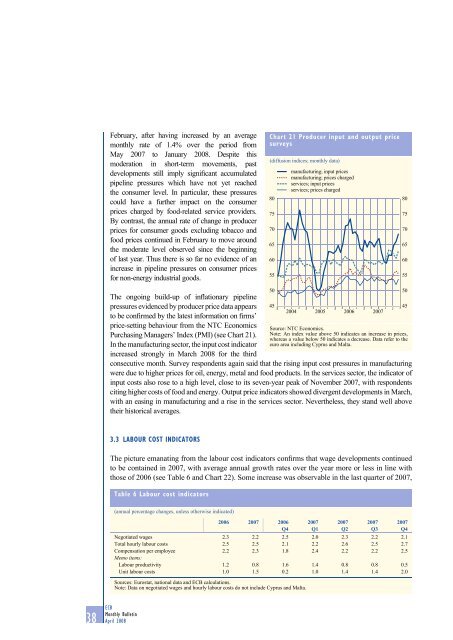
Chart 21 Producer input and output price<br />
surveys<br />
(diffusion indices; monthly data)<br />
80<br />
75<br />
70<br />
65<br />
60<br />
55<br />
manufacturing; input prices<br />
manufacturing; prices charged<br />
services; input prices<br />
services; prices charged<br />
80<br />
75<br />
70<br />
65<br />
60<br />
55<br />
The ongoing build-up of inflationary pipeline<br />
pressures evidenced by producer price data appears<br />
to be confirmed by the latest information on firms’<br />
price-setting behaviour from the NTC Economics<br />
Purchasing Managers’ Index (PMI) (see Chart 21).<br />
In the manufacturing sector, the input cost indicator<br />
increased strongly in March <strong>2008</strong> for the third<br />
consecutive month. Survey respondents again said that the rising input cost pressures in manufacturing<br />
were due to higher prices for oil, energy, metal and food products. In the services sector, the indicator of<br />
input costs also rose to a high level, close to its seven-year peak of November 2007, with respondents<br />
citing higher costs of food and energy. Output price indicators showed divergent developments in March,<br />
with an easing in manufacturing and a rise in the services sector. Nevertheless, they stand well above<br />
their historical averages.<br />
50<br />
45<br />
2004 2005 2006 2007<br />
Source: NTC Economics.<br />
Note: An index value above 50 indicates an increase in prices,<br />
whereas a value below 50 indicates a decrease. Data refer to the<br />
euro area including Cyprus and Malta.<br />
50<br />
45<br />
3.3 LABOUR COST INDICATORS<br />
The picture emanating from the labour cost indicators confirms that wage developments continued<br />
to be contained in 2007, with average annual growth rates over the year more or less in line with<br />
those of 2006 (see Table 6 and Chart 22). Some increase was observable in the last quarter of 2007,<br />
Table 6 Labour cost indicators<br />
(annual percentage changes, unless otherwise indicated)<br />
2006 2007 2006<br />
Q4<br />
Negotiated wages 2.3 2.2 2.5 2.0 2.3 2.2 2.1<br />
Total hourly labour costs 2.5 2.5 2.1 2.2 2.6 2.5 2.7<br />
Compensation per employee 2.2 2.3 1.8 2.4 2.2 2.2 2.5<br />
Memo items:<br />
Labour productivity 1.2 0.8 1.6 1.4 0.8 0.8 0.5<br />
Unit labour costs 1.0 1.5 0.2 1.0 1.4 1.4 2.0<br />
Sources: Eurostat, national data and ECB calculations.<br />
Note: Data on negotiated wages and hourly labour costs do not include Cyprus and Malta.<br />
2007<br />
Q1<br />
2007<br />
Q2<br />
2007<br />
Q3<br />
2007<br />
Q4<br />
38 ECB<br />
<strong>Monthly</strong> <strong>Bulletin</strong><br />
<strong>April</strong> <strong>2008</strong>


