

Monthly Bulletin April 2008 - European Central Bank - Europa
Monthly Bulletin April 2008 - European Central Bank - Europa
Monthly Bulletin April 2008 - European Central Bank - Europa

Create successful ePaper yourself
Turn your PDF publications into a flip-book with our unique Google optimized e-Paper software.
ECONOMIC<br />
AND MONETARY<br />
DEVELOPMENTS<br />
Prices and<br />
costs<br />
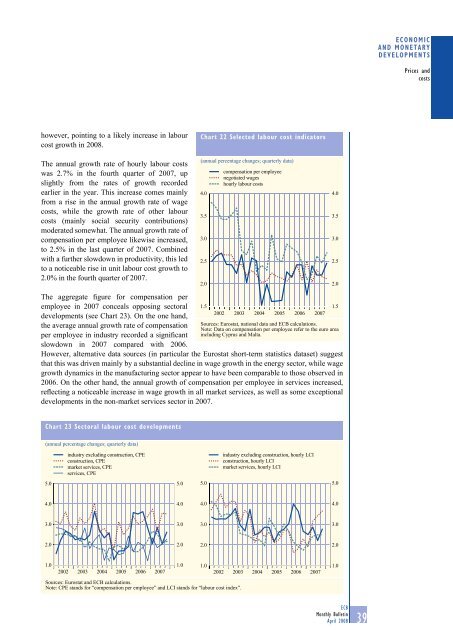
however, pointing to a likely increase in labour<br />
cost growth in <strong>2008</strong>.<br />
Chart 22 Selected labour cost indicators<br />
The annual growth rate of hourly labour costs<br />
was 2.7% in the fourth quarter of 2007, up<br />
slightly from the rates of growth recorded<br />
earlier in the year. This increase comes mainly<br />
from a rise in the annual growth rate of wage<br />
costs, while the growth rate of other labour<br />
costs (mainly social security contributions)<br />
moderated somewhat. The annual growth rate of<br />
compensation per employee likewise increased,<br />
to 2.5% in the last quarter of 2007. Combined<br />
with a further slowdown in productivity, this led<br />
to a noticeable rise in unit labour cost growth to<br />
2.0% in the fourth quarter of 2007.<br />
The aggregate figure for compensation per<br />
employee in 2007 conceals opposing sectoral<br />
developments (see Chart 23). On the one hand,<br />
the average annual growth rate of compensation<br />
per employee in industry recorded a significant<br />
slowdown in 2007 compared with 2006.<br />
(annual percentage changes; quarterly data)<br />
However, alternative data sources (in particular the Eurostat short-term statistics dataset) suggest<br />
that this was driven mainly by a substantial decline in wage growth in the energy sector, while wage<br />
growth dynamics in the manufacturing sector appear to have been comparable to those observed in<br />
2006. On the other hand, the annual growth of compensation per employee in services increased,<br />
reflecting a noticeable increase in wage growth in all market services, as well as some exceptional<br />
developments in the non-market services sector in 2007.<br />
4.0<br />
3.5<br />
3.0<br />
2.5<br />
2.0<br />
1.5<br />
compensation per employee<br />
negotiated wages<br />
hourly labour costs<br />
2002 2003 2004 2005 2006 2007<br />
Sources: Eurostat, national data and ECB calculations.<br />
Note: Data on compensation per employee refer to the euro area<br />
including Cyprus and Malta.<br />
4.0<br />
3.5<br />
3.0<br />
2.5<br />
2.0<br />
1.5<br />
Chart 23 Sectoral labour cost developments<br />
(annual percentage changes; quarterly data)<br />
industry excluding construction, CPE<br />
construction, CPE<br />
market services, CPE<br />
services, CPE<br />
industry excluding construction, hourly LCI<br />
construction, hourly LCI<br />
market services, hourly LCI<br />
5.0<br />
5.0<br />
5.0<br />
5.0<br />
4.0<br />
4.0<br />
4.0<br />
4.0<br />
3.0<br />
3.0<br />
3.0<br />
3.0<br />
2.0<br />
2.0<br />
2.0<br />
2.0<br />
1.0<br />
1.0 1.0<br />
2002 2003 2004 2005 2006 2007<br />
2002 2003 2004 2005 2006 2007<br />
Sources: Eurostat and ECB calculations.<br />
Note: CPE stands for “compensation per employee” and LCI stands for “labour cost index”.<br />
1.0<br />
ECB<br />
<strong>Monthly</strong> <strong>Bulletin</strong><br />
<strong>April</strong> <strong>2008</strong><br />
39


