4.2 Securities, other than shares, issued by euro area residents, by sector of the issuer and instrument type (EUR billions ; transactions during the month and end-of-period outstanding amounts; nominal values) 1. Outstanding amounts and gross issues Outstanding amounts Gross issues Total MFIs Non-MFI corporations General government Total MFIs Non-MFI corporations General government (including (including Eurosystem) Financial Non-financial <strong>Central</strong> Other Eurosystem) Financial Non-financial <strong>Central</strong> Other corporations corporations government general corporations corporations government general other than government other than government MFIs MFIs 1 2 3 4 5 6 7 8 9 10 11 12 Total 2006 11,101 4,573 1,171 636 4,417 305 11,360 8,396 423 1,114 1,342 85 2007 12,068 5,052 1,485 686 4,530 315 13,617 10,085 540 1,458 1,453 80 2007 Q1 11,490 4,768 1,265 648 4,499 309 3,317 2,452 141 285 416 23 Q2 11,806 4,878 1,325 684 4,610 308 3,347 2,369 118 453 389 18 Q3 11,901 4,960 1,356 679 4,595 310 3,451 2,604 88 394 346 19 Q4 12,068 5,052 1,485 686 4,530 315 3,502 2,660 192 326 302 21 2007 Oct. 12,045 5,059 1,398 689 4,584 315 1,346 1,003 68 126 140 10 Nov. 12,088 5,062 1,420 692 4,597 317 1,158 897 36 109 110 6 Dec. 12,068 5,052 1,485 686 4,530 315 997 761 88 91 52 5 <strong>2008</strong> Jan. 12,138 5,103 1,477 697 4,546 315 1,195 888 7 108 181 12 Short-term 2006 1,015 575 12 94 330 4 9,194 7,392 59 1,023 688 31 2007 1,290 787 18 122 357 7 11,348 9,052 58 1,366 832 38 2007 Q1 1,134 626 12 106 386 4 2,657 2,138 16 271 223 8 Q2 1,175 632 11 120 407 5 2,726 2,081 12 413 210 9 Q3 1,257 715 9 117 409 7 3,012 2,406 10 378 207 11 Q4 1,290 787 18 122 357 7 2,952 2,427 20 303 192 10 2007 Oct. 1,341 777 15 126 414 7 1,123 906 11 117 84 4 Nov. 1,344 786 16 127 408 8 1,004 828 3 101 69 2 Dec. 1,290 787 18 122 357 7 826 694 5 86 39 3 <strong>2008</strong> Jan. 1,361 825 18 131 380 7 1,006 793 3 104 101 5 Long-term 1) 2006 10,086 3,998 1,159 542 4,087 301 2,166 1,004 363 90 654 54 2007 10,778 4,265 1,467 565 4,173 309 2,269 1,032 482 92 621 42 2007 Q1 10,356 4,142 1,253 542 4,114 304 660 314 125 13 193 14 Q2 10,631 4,246 1,314 564 4,203 304 621 287 106 40 179 8 Q3 10,644 4,245 1,347 562 4,186 304 439 198 79 16 138 8 Q4 10,778 4,265 1,467 565 4,173 309 550 233 172 23 110 11 2007 Oct. 10,704 4,281 1,383 562 4,170 308 224 97 57 9 56 5 Nov. 10,744 4,276 1,404 565 4,190 309 155 69 33 8 41 4 Dec. 10,778 4,265 1,467 565 4,173 309 171 67 83 6 14 2 <strong>2008</strong> Jan. 10,777 4,278 1,459 566 4,166 308 190 95 5 3 80 7 Of which long-term fixed rate 2006 7,059 2,136 544 413 3,729 237 1,292 475 143 56 579 39 2007 7,326 2,272 589 428 3,787 250 1,280 530 116 57 540 36 2007 Q1 7,176 2,211 570 414 3,739 243 404 172 40 9 170 13 Q2 7,319 2,256 584 426 3,809 244 339 132 29 24 147 7 Q3 7,319 2,254 591 423 3,805 246 263 100 24 8 123 7 Q4 7,326 2,272 589 428 3,787 250 274 126 23 17 99 8 2007 Oct. 7,325 2,281 588 426 3,780 250 122 54 11 6 47 4 Nov. 7,350 2,282 587 430 3,799 252 95 41 4 8 39 4 Dec. 7,326 2,272 589 428 3,787 250 56 31 8 3 13 1 <strong>2008</strong> Jan. 7,305 2,278 587 428 3,766 247 122 48 2 2 65 4 Of which long-term variable rate 2006 2,608 1,512 604 115 312 64 719 408 216 31 49 15 2007 2,996 1,614 859 126 338 58 817 371 356 33 51 5 2007 Q1 2,729 1,564 671 115 318 61 213 114 83 4 12 1 Q2 2,850 1,608 716 126 341 60 228 112 76 16 23 1 Q3 2,870 1,610 739 128 336 57 138 71 51 7 8 1 Q4 2,996 1,614 859 126 338 58 237 74 146 7 8 3 2007 Oct. 2,915 1,612 778 125 342 58 84 28 45 3 6 1 Nov. 2,934 1,611 799 124 343 57 50 20 27 1 2 0 Dec. 2,996 1,614 859 126 338 58 103 25 74 3 0 1 <strong>2008</strong> Jan. 3,005 1,618 854 127 346 60 46 32 2 1 8 3 Source: ECB. 1) The residual difference between total long-term debt securities and fixed and variable rate long-term debt securities consists of zero coupon bonds and revaluation effects. S 36 ECB <strong>Monthly</strong> <strong>Bulletin</strong> <strong>April</strong> <strong>2008</strong>
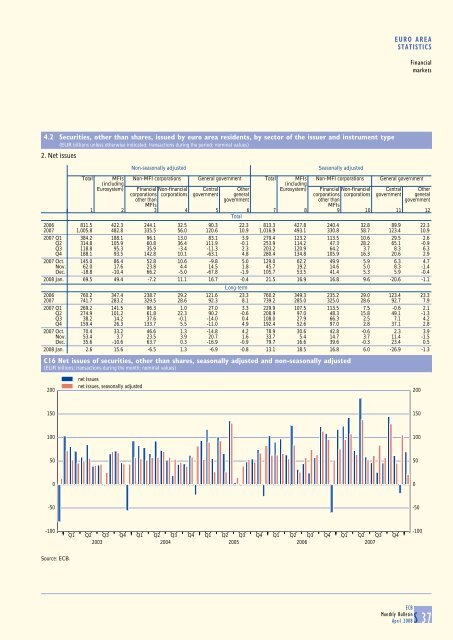
EURO AREA STATISTICS Financial markets 4.2 Securities, other than shares, issued by euro area residents, by sector of the issuer and instrument type (EUR billions unless otherwise indicated; transactions during the period; nominal values) 2. Net issues Non-seasonally adjusted Seasonally adjusted Total MFIs Non-MFI corporations General government Total MFIs Non-MFI corporations General government (including (including Eurosystem) Financial Non-financial <strong>Central</strong> Other Eurosystem) Financial Non-financial <strong>Central</strong> Other corporations corporations government general corporations corporations government general other than government other than government MFIs MFIs 1 2 3 4 5 6 7 8 9 10 11 12 Total 2006 811.5 422.3 244.1 32.5 90.3 22.3 813.3 427.8 240.4 32.8 89.9 22.3 2007 1,005.8 482.8 335.5 56.0 120.6 10.9 1,016.9 493.1 330.8 58.7 123.4 10.9 2007 Q1 384.2 188.1 96.1 13.0 83.1 3.9 279.4 123.2 113.5 10.6 29.5 2.6 Q2 314.8 105.9 60.8 36.4 111.9 -0.1 253.9 114.2 47.3 28.2 65.1 -0.9 Q3 118.8 95.3 35.9 -3.4 -11.3 2.3 203.2 120.9 64.2 3.7 8.3 6.3 Q4 188.1 93.5 142.8 10.1 -63.1 4.8 280.4 134.8 105.9 16.3 20.6 2.9 2007 Oct. 145.0 86.4 52.8 10.6 -9.8 5.0 129.0 62.2 49.9 5.9 6.3 4.7 Nov. 62.0 17.6 23.8 4.4 14.5 1.8 45.7 19.2 14.6 5.0 8.3 -1.4 Dec. -18.8 -10.4 66.2 -5.0 -67.8 -1.9 105.7 53.5 41.4 5.3 5.9 -0.4 <strong>2008</strong> Jan. 69.5 49.4 -7.2 11.1 16.7 -0.4 21.5 16.9 16.8 9.6 -20.6 -1.1 Long-term 2006 760.2 347.4 238.7 29.2 121.6 23.3 760.2 349.3 235.2 29.0 123.4 23.3 2007 741.7 283.2 329.5 28.6 92.3 8.1 739.2 285.0 325.0 28.6 92.7 7.9 2007 Q1 269.2 141.5 96.3 1.0 27.0 3.3 229.9 107.5 113.5 7.5 -0.6 2.1 Q2 274.9 101.2 61.8 22.3 90.2 -0.6 208.9 97.0 48.3 15.8 49.1 -1.3 Q3 38.2 14.2 37.6 -0.1 -14.0 0.4 108.0 27.9 66.3 2.5 7.1 4.2 Q4 159.4 26.3 133.7 5.5 -11.0 4.9 192.4 52.6 97.0 2.8 37.1 2.8 2007 Oct. 70.4 33.2 46.6 1.3 -14.8 4.2 78.9 30.6 42.8 -0.6 2.3 3.9 Nov. 53.4 3.7 23.5 3.9 20.7 1.6 33.7 5.4 14.7 3.7 11.4 -1.5 Dec. 35.6 -10.6 63.7 0.3 -16.9 -0.9 79.7 16.6 39.6 -0.3 23.4 0.5 <strong>2008</strong> Jan. 2.6 15.6 -6.5 1.3 -6.9 -0.8 13.1 18.5 16.8 6.0 -26.9 -1.3 C16 Net issues of securities, other than shares, seasonally adjusted and non-seasonally adjusted (EUR billions; transactions during the month; nominal values) 200 net issues net issues, seasonally adjusted 200 150 150 100 100 50 50 0 0 -50 -50 -100 Q1 Q2 Q3 Q4 Q1 Q2 Q3 Q4 Q1 Q2 Q3 Q4 Q1 Q2 Q3 Q4 Q1 Q2 Q3 Q4 2003 2004 2005 2006 2007 -100 Source: ECB. ECB <strong>Monthly</strong> <strong>Bulletin</strong> <strong>April</strong> <strong>2008</strong>S 37
- Page 1 and 2:
EN EUROPEAN CENTRAL BANK MONTHLY BU
- Page 3 and 4:
© European Central Bank 2008 Addre
- Page 5 and 6:
ABBREVIATIONS COUNTRIES LU Luxembou
- Page 7 and 8:
months, moderating only gradually o
- Page 10 and 11:
ECONOMIC AND MONETARY DEVELOPMENTS
- Page 12 and 13:
ECONOMIC AND MONETARY DEVELOPMENTS
- Page 14 and 15:
ECONOMIC AND MONETARY DEVELOPMENTS
- Page 16 and 17:
ECONOMIC AND MONETARY DEVELOPMENTS
- Page 18 and 19:
ECONOMIC AND MONETARY DEVELOPMENTS
- Page 20 and 21:
ECONOMIC AND MONETARY DEVELOPMENTS
- Page 22 and 23:
ECONOMIC AND MONETARY DEVELOPMENTS
- Page 24 and 25:
ECONOMIC AND MONETARY DEVELOPMENTS
- Page 26 and 27:
ECONOMIC AND MONETARY DEVELOPMENTS
- Page 28 and 29:
ECONOMIC AND MONETARY DEVELOPMENTS
- Page 30 and 31:
ECONOMIC AND MONETARY DEVELOPMENTS
- Page 32 and 33:
ECONOMIC AND MONETARY DEVELOPMENTS
- Page 34 and 35:
ECONOMIC AND MONETARY DEVELOPMENTS
- Page 36 and 37:
ECONOMIC AND MONETARY DEVELOPMENTS
- Page 38 and 39:
ECONOMIC AND MONETARY DEVELOPMENTS
- Page 40 and 41:
ECONOMIC AND MONETARY DEVELOPMENTS
- Page 42 and 43:
ECONOMIC AND MONETARY DEVELOPMENTS
- Page 44 and 45:
ECONOMIC AND MONETARY DEVELOPMENTS
- Page 46 and 47:
ECONOMIC AND MONETARY DEVELOPMENTS
- Page 48 and 49:
ECONOMIC AND MONETARY DEVELOPMENTS
- Page 50 and 51:
ECONOMIC AND MONETARY DEVELOPMENTS
- Page 52 and 53:
ECONOMIC AND MONETARY DEVELOPMENTS
- Page 54 and 55:
ECONOMIC AND MONETARY DEVELOPMENTS
- Page 56 and 57:
ECONOMIC AND MONETARY DEVELOPMENTS
- Page 58 and 59:
ARTICLES BUSINESS INVESTMENT IN THE
- Page 60 and 61:
Thereafter, in the early part of th
- Page 62 and 63:
from an investment project in order
- Page 64 and 65:
of fixed capital investment, but al
- Page 66 and 67:
ARTICLES of 2007. However, as monet
- Page 68 and 69:
ARTICLES Relationship between inves
- Page 70 and 71:
SHORT-TERM FORECASTS OF ECONOMIC AC
- Page 72 and 73:
designed to extract the common move
- Page 74 and 75: Chart 2 Evolution of GDP forecast p
- Page 76 and 77: DEVELOPMENTS IN THE EU ARRANGEMENTS
- Page 78 and 79: ability to deliver results, and pro
- Page 80 and 81: anking acts in line with the spirit
- Page 82 and 83: There is a close interrelationship
- Page 84 and 85: ARTICLES 2. In a crisis situation,
- Page 86 and 87: the role of the consolidating super
- Page 88 and 89: The ECB strongly supports the initi
- Page 91 and 92: CONTENTS 1 EURO AREA OVERVIEW Summa
- Page 93 and 94: EURO AREA OVERVIEW Summary of econo
- Page 95 and 96: EURO AREA STATISTICS Monetary polic
- Page 97 and 98: EURO AREA STATISTICS Monetary polic
- Page 99 and 100: EURO AREA STATISTICS Money, banking
- Page 101 and 102: EURO AREA STATISTICS Money, banking
- Page 103 and 104: EURO AREA STATISTICS Money, banking
- Page 105 and 106: EURO AREA STATISTICS Money, banking
- Page 107 and 108: EURO AREA STATISTICS Money, banking
- Page 109 and 110: EURO AREA STATISTICS Money, banking
- Page 111 and 112: EURO AREA STATISTICS Money, banking
- Page 113 and 114: EURO AREA STATISTICS Money, banking
- Page 115 and 116: EURO AREA STATISTICS Euro area acco
- Page 117 and 118: EURO AREA STATISTICS Euro area acco
- Page 119 and 120: EURO AREA STATISTICS Euro area acco
- Page 121 and 122: EURO AREA STATISTICS Euro area acco
- Page 123: FINANCIAL MARKETS 4 4.1 Securities,
- Page 127 and 128: EURO AREA STATISTICS Financial mark
- Page 129 and 130: EURO AREA STATISTICS Financial mark
- Page 131 and 132: EURO AREA STATISTICS Financial mark
- Page 133 and 134: EURO AREA STATISTICS Financial mark
- Page 135 and 136: PRICES, OUTPUT, DEMAND AND LABOUR M
- Page 137 and 138: EURO AREA STATISTICS Prices, output
- Page 139 and 140: EURO AREA STATISTICS Prices, output
- Page 141 and 142: EURO AREA STATISTICS Prices, output
- Page 143 and 144: GOVERNMENT FINANCE 6 6.1 Revenue, e
- Page 145 and 146: EURO AREA STATISTICS Government fin
- Page 147 and 148: EURO AREA STATISTICS Government fin
- Page 149 and 150: EURO AREA STATISTICS External trans
- Page 151 and 152: EURO AREA STATISTICS External trans
- Page 153 and 154: EURO AREA STATISTICS External trans
- Page 155 and 156: EURO AREA STATISTICS External trans
- Page 157 and 158: EURO AREA STATISTICS External trans
- Page 159 and 160: EURO AREA STATISTICS External trans
- Page 161 and 162: EURO AREA STATISTICS Exchange rates
- Page 163 and 164: EURO AREA STATISTICS Developments o
- Page 165 and 166: TECHNICAL NOTES RELATING TO THE EUR
- Page 167 and 168: EURO AREA STATISTICS Technical note
- Page 169: EURO AREA STATISTICS Technical note
- Page 172 and 173: OVERVIEW Developments in key indica
- Page 174 and 175:
EURO AREA ACCOUNTS Section 3.1 show
- Page 176 and 177:
seasonally adjusted growth rates ha
- Page 178 and 179:
using harmonised criteria and defin
- Page 180 and 181:
statistics, such as the MFI consoli
- Page 183 and 184:
ANNEXES CHRONOLOGY OF MONETARY POLI
- Page 185:
CHRONOLOGY 5 JULY, 2 AUGUST, 6 SEPT
- Page 188 and 189:
“Globalisation, trade and the eur
- Page 190 and 191:
853 “The cyclical behaviour of eq
- Page 192 and 193:
“Bond markets and long-term inter
- Page 194 and 195:
Debt (general government): the gros
- Page 196 and 197:
Fixed rate tender: a tender procedu
- Page 198 and 199:
MFI interest rates: the interest ra