

Monthly Bulletin April 2008 - European Central Bank - Europa
Monthly Bulletin April 2008 - European Central Bank - Europa
Monthly Bulletin April 2008 - European Central Bank - Europa

Create successful ePaper yourself
Turn your PDF publications into a flip-book with our unique Google optimized e-Paper software.
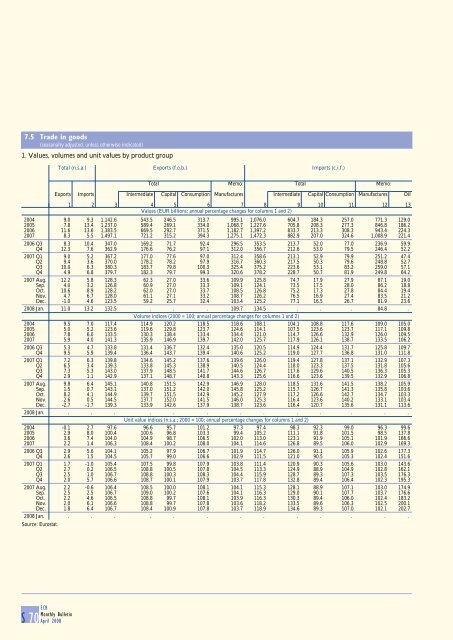
7.5 Trade in goods<br />
(seasonally adjusted, unless otherwise indicated)<br />
1. Values, volumes and unit values by product group<br />
Total (n.s.a.) Exports (f.o.b.) Imports (c.i.f.)<br />
Total Memo: Total Memo:<br />
Exports Imports Intermediate Capital Consumption Manufactures Intermediate Capital Consumption Manufactures Oil<br />
1 2 3 4 5 6 7 8 9 10 11 12 13<br />
Values (EUR billions; annual percentage changes for columns 1 and 2)<br />
2004 9.0 9.3 1,142.6 543.5 246.5 313.7 995.1 1,076.0 604.7 184.3 257.0 771.3 129.0<br />
2005 7.8 13.4 1,237.0 589.4 269.1 334.0 1,068.7 1,227.6 705.8 208.3 277.3 846.8 186.2<br />
2006 11.6 13.6 1,383.5 669.5 292.7 371.5 1,182.7 1,397.2 833.7 213.3 308.3 943.4 224.3<br />
2007 8.3 5.5 1,497.1 721.2 315.2 394.3 1,275.1 1,472.3 882.9 207.0 324.6 1,008.9 221.4<br />
2006 Q3 8.3 10.4 347.0 169.2 71.7 92.4 296.5 353.5 213.7 52.0 77.0 236.9 59.9<br />
Q4 12.3 7.6 362.9 176.6 76.2 97.1 312.0 356.7 212.6 53.0 79.5 246.4 52.2<br />
2007 Q1 9.0 5.2 367.2 177.0 77.6 97.0 312.4 358.6 213.1 52.9 79.9 251.2 47.4<br />
Q2 9.4 3.6 370.0 178.2 78.2 97.9 316.7 360.3 217.5 50.3 79.6 248.8 52.7<br />
Q3 10.0 6.3 380.3 183.7 79.8 100.3 325.4 375.2 223.6 53.1 83.2 259.0 57.1<br />
Q4 4.9 6.8 379.7 182.3 79.7 99.3 320.6 378.2 228.7 50.7 81.9 249.8 64.2<br />
2007 Aug. 12.2 5.8 128.3 62.3 27.0 33.6 109.9 125.8 74.7 17.9 27.9 87.1 19.0<br />
Sep. 4.0 3.2 126.8 60.9 27.0 33.3 109.1 124.1 73.5 17.5 28.0 86.2 18.8<br />
Oct. 10.6 8.9 128.2 62.0 27.0 33.7 108.5 126.8 75.2 17.3 27.8 84.4 19.4<br />
Nov. 4.7 6.7 128.0 61.1 27.1 33.2 108.7 126.2 76.5 16.9 27.4 83.5 21.2<br />
Dec. -1.0 4.6 123.5 59.2 25.7 32.4 103.4 125.2 77.1 16.5 26.7 81.9 23.6<br />
<strong>2008</strong> Jan. 11.0 13.2 132.5 . . . 109.7 134.5 . . . 84.8 .<br />
Volume indices (2000 = 100; annual percentage changes for columns 1 and 2)<br />
2004 9.5 7.0 117.4 114.9 120.2 118.5 118.6 108.1 104.1 108.8 117.6 109.0 105.0<br />
2005 5.0 5.2 123.6 119.6 129.8 123.7 124.6 114.1 107.5 123.6 123.7 117.1 109.8<br />
2006 7.8 6.0 133.5 130.3 138.4 133.4 134.4 121.0 114.7 126.6 132.9 126.0 109.5<br />
2007 5.9 4.0 141.3 135.9 146.9 139.7 142.0 125.7 117.9 126.1 138.7 133.5 106.2<br />
2006 Q3 5.3 4.7 133.8 131.4 136.7 132.4 135.0 120.5 114.9 124.4 131.7 125.8 109.7<br />
Q4 9.5 5.9 139.4 136.4 143.7 139.4 140.6 125.2 119.0 127.7 136.8 131.0 111.8<br />
2007 Q1 7.2 6.3 139.8 134.6 145.2 137.6 139.6 126.0 119.4 127.8 137.1 132.9 107.3<br />
Q2 6.5 3.4 139.3 133.8 145.3 138.9 140.5 124.4 118.0 123.3 137.5 131.8 105.6<br />
Q3 7.3 5.3 143.0 137.9 148.5 141.7 144.6 126.7 117.6 129.6 140.5 136.3 105.3<br />
Q4 2.9 1.1 142.9 137.1 148.7 140.8 143.3 125.6 116.6 123.6 139.5 132.9 106.8<br />
2007 Aug. 9.8 6.4 145.1 140.8 151.5 142.9 146.9 128.0 118.5 131.6 141.5 138.2 105.9<br />
Sep. 1.5 0.7 143.1 137.0 151.2 142.0 145.8 125.2 115.7 126.7 141.3 135.8 103.6<br />
Oct. 8.2 4.1 144.9 139.7 151.5 142.9 145.2 127.9 117.2 126.6 142.7 134.7 103.3<br />
Nov. 2.6 0.5 144.5 137.7 152.0 141.5 146.0 125.3 116.4 123.6 140.2 133.1 103.4<br />
Dec. -2.7 -1.7 139.3 133.9 142.6 137.9 138.7 123.6 116.4 120.7 135.6 131.1 113.6<br />
<strong>2008</strong> Jan. . . . . . . . . . . . . .<br />
Unit value indices (n.s.a.; 2000 = 100; annual percentage changes for columns 1 and 2)<br />
2004 -0.1 2.7 97.6 96.6 95.7 101.2 97.3 97.4 98.3 92.3 99.0 96.3 99.6<br />
2005 2.9 8.0 100.4 100.6 96.8 103.3 99.4 105.2 111.1 91.8 101.5 98.5 137.8<br />
2006 3.6 7.4 104.0 104.9 98.7 106.5 102.0 113.0 123.1 91.9 105.1 101.9 166.6<br />
2007 2.2 1.4 106.3 108.4 100.2 108.0 104.1 114.6 126.8 89.5 106.0 102.9 169.3<br />
2006 Q3 2.9 5.6 104.1 105.2 97.9 106.7 101.9 114.7 126.0 91.1 105.9 102.6 177.3<br />
Q4 2.6 1.5 104.5 105.7 99.0 106.6 102.9 111.5 121.0 90.5 105.3 102.4 151.6<br />
2007 Q1 1.7 -1.0 105.4 107.5 99.8 107.9 103.8 111.4 120.9 90.3 105.6 103.0 143.6<br />
Q2 2.7 0.2 106.5 108.8 100.5 107.8 104.5 113.3 124.9 88.9 104.9 102.8 162.1<br />
Q3 2.5 1.0 106.7 108.8 100.3 108.3 104.4 115.9 128.7 89.3 107.3 103.5 176.3<br />
Q4 2.0 5.7 106.6 108.7 100.1 107.9 103.7 117.8 132.8 89.4 106.4 102.3 195.3<br />
2007 Aug. 2.2 -0.6 106.4 108.5 100.0 108.1 104.1 115.3 128.1 88.9 107.1 103.0 174.9<br />
Sep. 2.5 2.5 106.7 109.0 100.2 107.6 104.1 116.3 129.0 90.1 107.7 103.7 176.6<br />
Oct. 2.2 4.6 106.5 108.8 99.7 108.1 103.9 116.3 130.3 89.4 106.0 102.4 183.2<br />
Nov. 2.0 6.1 106.6 108.8 99.7 107.8 103.6 118.2 133.5 89.6 106.3 102.5 200.1<br />
Dec. 1.8 6.4 106.7 108.4 100.9 107.8 103.7 118.9 134.6 89.3 107.0 102.1 202.7<br />
<strong>2008</strong> Jan. . . . . . . . . . . . . .<br />
Source: Eurostat.<br />
S 70 ECB<br />
<strong>Monthly</strong> <strong>Bulletin</strong><br />
<strong>April</strong> <strong>2008</strong>


