

Monthly Bulletin April 2008 - European Central Bank - Europa
Monthly Bulletin April 2008 - European Central Bank - Europa
Monthly Bulletin April 2008 - European Central Bank - Europa

Create successful ePaper yourself
Turn your PDF publications into a flip-book with our unique Google optimized e-Paper software.
EURO AREA<br />
STATISTICS<br />
Euro area<br />
accounts<br />
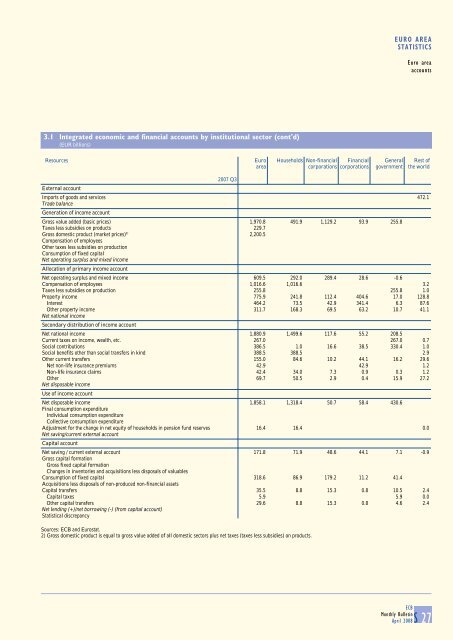
3.1 Integrated economic and financial accounts by institutional sector (cont'd)<br />
(EUR billions)<br />
Resources Euro Households Non-financial Financial General Rest of<br />
area corporations corporations government the world<br />
2007 Q3<br />
External account<br />
Imports of goods and services 472.1<br />
Trade balance<br />
Generation of income account<br />
Gross value added (basic prices) 1,970.8 491.9 1,129.2 93.9 255.8<br />
Taxes less subsidies on products 229.7<br />
Gross domestic product (market prices) 2) 2,200.5<br />
Compensation of employees<br />
Other taxes less subsidies on production<br />
Consumption of fixed capital<br />
Net operating surplus and mixed income<br />
Allocation of primary income account<br />
Net operating surplus and mixed income 609.5 292.0 289.4 28.6 -0.6<br />
Compensation of employees 1,016.6 1,016.6 3.2<br />
Taxes less subsidies on production 255.8 255.8 1.0<br />
Property income 775.9 241.8 112.4 404.6 17.0 128.8<br />
Interest 464.2 73.5 42.9 341.4 6.3 87.6<br />
Other property income 311.7 168.3 69.5 63.2 10.7 41.1<br />
Net national income<br />
Secondary distribution of income account<br />
Net national income 1,880.9 1,499.6 117.6 55.2 208.5<br />
Current taxes on income, wealth, etc. 267.0 267.0 0.7<br />
Social contributions 386.5 1.0 16.6 38.5 330.4 1.0<br />
Social benefits other than social transfers in kind 388.5 388.5 2.9<br />
Other current transfers 155.0 84.6 10.2 44.1 16.2 29.6<br />
Net non-life insurance premiums 42.9 42.9 1.2<br />
Non-life insurance claims 42.4 34.0 7.3 0.9 0.3 1.2<br />
Other 69.7 50.5 2.9 0.4 15.9 27.2<br />
Net disposable income<br />
Use of income account<br />
Net disposable income 1,858.1 1,318.4 50.7 58.4 430.6<br />
Final consumption expenditure<br />
Individual consumption expenditure<br />
Collective consumption expenditure<br />
Adjustment for the change in net equity of households in pension fund reserves 16.4 16.4 0.0<br />
Net saving/current external account<br />
Capital account<br />
Net saving / current external account 171.8 71.9 48.6 44.1 7.1 -0.9<br />
Gross capital formation<br />
Gross fixed capital formation<br />
Changes in inventories and acquisitions less disposals of valuables<br />
Consumption of fixed capital 318.6 86.9 179.2 11.2 41.4<br />
Acquisitions less disposals of non-produced non-financial assets<br />
Capital transfers 35.5 8.8 15.3 0.8 10.5 2.4<br />
Capital taxes 5.9 5.9 0.0<br />
Other capital transfers 29.6 8.8 15.3 0.8 4.6 2.4<br />
Net lending (+)/net borrowing (-) (from capital account)<br />
Statistical discrepancy<br />
Sources: ECB and Eurostat.<br />
2) Gross domestic product is equal to gross value added of all domestic sectors plus net taxes (taxes less subsidies) on products.<br />
ECB<br />
<strong>Monthly</strong> <strong>Bulletin</strong><br />
<strong>April</strong> <strong>2008</strong>S 27


