

Monthly Bulletin April 2008 - European Central Bank - Europa
Monthly Bulletin April 2008 - European Central Bank - Europa
Monthly Bulletin April 2008 - European Central Bank - Europa

You also want an ePaper? Increase the reach of your titles
YUMPU automatically turns print PDFs into web optimized ePapers that Google loves.
EURO AREA<br />
STATISTICS<br />
Financial<br />
markets<br />
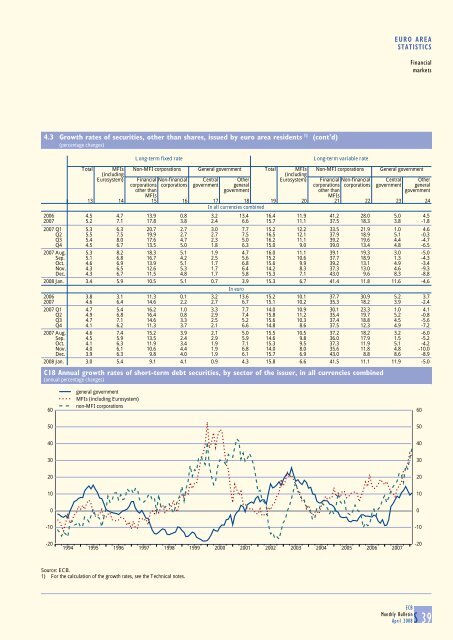
4.3 Growth rates of securities, other than shares, issued by euro area residents 1) (cont'd)<br />
(percentage changes)<br />
Long-term fixed rate Long-term variable rate<br />
Total MFIs Non-MFI corporations General government Total MFIs Non-MFI corporations General government<br />
(including<br />
(including<br />
Eurosystem) Financial Non-financial <strong>Central</strong> Other Eurosystem) Financial Non-financial <strong>Central</strong> Other<br />
corporations corporations government general corporations corporations government general<br />
other than government other than government<br />
MFIs<br />
MFIs<br />
13 14 15 16 17 18 19 20 21 22 23 24<br />
In all currencies combined<br />
2006 4.5 4.7 13.9 0.8 3.2 13.4 16.4 11.9 41.2 28.0 5.0 4.5<br />
2007 5.2 7.1 17.8 3.8 2.4 6.6 15.7 11.1 37.5 18.3 3.8 -1.8<br />
2007 Q1 5.3 6.3 20.7 2.7 3.0 7.7 15.2 12.2 33.5 21.9 1.0 4.6<br />
Q2 5.5 7.5 19.9 2.7 2.7 7.5 16.5 12.1 37.9 18.9 5.1 -0.3<br />
Q3 5.4 8.0 17.6 4.7 2.3 5.0 16.2 11.1 39.2 19.6 4.4 -4.7<br />
Q4 4.5 6.7 13.5 5.0 1.8 6.3 15.0 9.0 39.0 13.4 4.8 -6.5<br />
2007 Aug. 5.3 8.2 18.3 5.1 1.9 4.7 16.0 11.1 39.1 19.3 3.0 -5.0<br />
Sep. 5.1 6.8 16.7 4.2 2.5 5.6 15.2 10.6 37.7 18.9 1.3 -4.3<br />
Oct. 4.6 6.9 13.9 5.1 1.7 6.8 15.6 9.9 39.2 13.1 4.9 -3.4<br />
Nov. 4.3 6.5 12.6 5.3 1.7 6.4 14.2 8.3 37.3 13.0 4.6 -9.3<br />
Dec. 4.3 6.7 11.5 4.8 1.7 5.8 15.3 7.1 43.0 9.6 8.3 -8.8<br />
<strong>2008</strong> Jan. 3.4 5.9 10.5 5.1 0.7 3.9 15.3 6.7 41.4 11.8 11.6 -4.6<br />
In euro<br />
2006 3.8 3.1 11.3 0.1 3.2 13.6 15.2 10.1 37.7 30.9 5.2 3.7<br />
2007 4.6 6.4 14.6 2.2 2.7 6.7 15.1 10.2 35.3 18.2 3.9 -2.4<br />
2007 Q1 4.7 5.4 16.2 1.0 3.3 7.7 14.0 10.9 30.1 23.3 1.0 4.1<br />
Q2 4.9 6.8 16.4 0.8 2.9 7.4 15.8 11.2 35.4 19.7 5.2 -0.8<br />
Q3 4.7 7.1 14.6 3.3 2.5 5.2 15.6 10.3 37.4 18.8 4.5 -5.6<br />
Q4 4.1 6.2 11.3 3.7 2.1 6.6 14.8 8.6 37.5 12.3 4.9 -7.2<br />
2007 Aug. 4.6 7.4 15.2 3.9 2.1 5.0 15.5 10.5 37.2 18.2 3.2 -6.0<br />
Sep. 4.5 5.9 13.5 2.4 2.9 5.9 14.6 9.8 36.0 17.9 1.5 -5.2<br />
Oct. 4.1 6.3 11.9 3.4 1.9 7.1 15.3 9.5 37.3 11.9 5.1 -4.2<br />
Nov. 4.0 6.1 10.6 4.4 1.9 6.8 14.0 8.0 35.6 11.8 4.8 -10.0<br />
Dec. 3.9 6.3 9.8 4.0 1.9 6.1 15.7 6.9 43.0 8.8 8.6 -8.9<br />
<strong>2008</strong> Jan. 3.0 5.4 9.1 4.1 0.9 4.3 15.8 6.6 41.5 11.1 11.9 -5.0<br />
C18 Annual growth rates of short-term debt securities, by sector of the issuer, in all currencies combined<br />
(annual percentage changes)<br />
60<br />
general government<br />
MFIs (including Eurosystem)<br />
non-MFI corporations<br />
60<br />
50<br />
50<br />
40<br />
40<br />
30<br />
30<br />
20<br />
20<br />
10<br />
10<br />
0<br />
0<br />
-10<br />
-10<br />
-20<br />
1994 1995 1996 1997 1998 1999 2000 2001 2002 2003 2004 2005 2006 2007<br />
-20<br />
Source: ECB.<br />
1) For the calculation of the growth rates, see the Technical notes.<br />
ECB<br />
<strong>Monthly</strong> <strong>Bulletin</strong><br />
<strong>April</strong> <strong>2008</strong>S 39


