

Monthly Bulletin April 2008 - European Central Bank - Europa
Monthly Bulletin April 2008 - European Central Bank - Europa
Monthly Bulletin April 2008 - European Central Bank - Europa

Create successful ePaper yourself
Turn your PDF publications into a flip-book with our unique Google optimized e-Paper software.
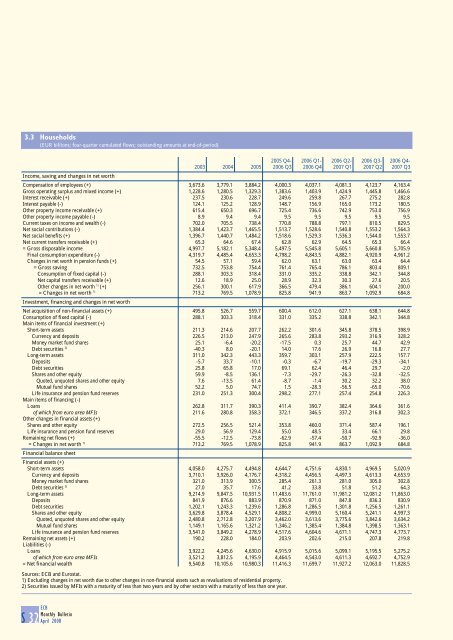
3.3 Households<br />
(EUR billions; four-quarter cumulated flows; outstanding amounts at end-of-period)<br />
Income, saving and changes in net worth<br />
2005 Q4- 2006 Q1- 2006 Q2- 2006 Q3- 2006 Q4-<br />
2003 2004 2005 2006 Q3 2006 Q4 2007 Q1 2007 Q2 2007 Q3<br />
Compensation of employees (+) 3,673.6 3,779.1 3,884.2 4,000.3 4,037.1 4,081.3 4,123.7 4,163.4<br />
Gross operating surplus and mixed income (+) 1,228.6 1,280.5 1,329.3 1,383.6 1,403.9 1,424.9 1,445.8 1,466.6<br />
Interest receivable (+) 237.5 230.6 228.7 249.6 259.8 267.7 275.2 282.8<br />
Interest payable (-) 124.1 125.2 128.9 148.7 156.9 165.0 173.2 180.5<br />
Other property income receivable (+) 615.4 650.3 696.7 725.4 736.6 742.9 753.0 756.9<br />
Other property income payable (-) 8.9 9.4 9.4 9.5 9.5 9.5 9.5 9.5<br />
Current taxes on income and wealth (-) 702.0 705.5 738.4 770.8 788.8 797.1 810.5 829.5<br />
Net social contributions (-) 1,384.4 1,423.7 1,465.5 1,513.7 1,528.6 1,540.8 1,553.2 1,564.3<br />
Net social benefits (+) 1,396.7 1,440.7 1,484.2 1,518.6 1,529.3 1,536.3 1,544.0 1,553.7<br />
Net current transfers receivable (+) 65.3 64.6 67.4 62.8 62.9 64.5 65.3 66.4<br />
= Gross disposable income 4,997.7 5,182.1 5,348.4 5,497.5 5,545.8 5,605.1 5,660.8 5,705.9<br />
Final consumption expenditure (-) 4,319.7 4,485.4 4,653.3 4,798.2 4,843.5 4,882.1 4,920.9 4,961.2<br />
Changes in net worth in pension funds (+) 54.5 57.1 59.4 62.0 63.1 63.0 63.4 64.4<br />
= Gross saving 732.5 753.8 754.4 761.4 765.4 786.1 803.4 809.1<br />
Consumption of fixed capital (-) 288.1 303.3 318.4 331.0 335.2 338.8 342.1 344.8<br />
Net capital transfers receivable (+) 12.6 18.9 25.0 28.9 32.3 30.3 27.6 20.5<br />
Other changes in net worth 1) (+) 256.1 300.1 617.9 366.5 479.4 386.1 604.1 200.0<br />
= Changes in net worth 1) 713.2 769.5 1,078.9 825.8 941.9 863.7 1,092.9 684.8<br />
Investment, financing and changes in net worth<br />
Net acquisition of non-financial assets (+) 495.8 526.7 559.7 600.4 612.0 627.1 638.1 644.8<br />
Consumption of fixed capital (-) 288.1 303.3 318.4 331.0 335.2 338.8 342.1 344.8<br />
Main items of financial investment (+)<br />
Short-term assets 211.3 214.6 207.7 262.2 301.6 345.8 378.5 398.9<br />
Currency and deposits 226.5 213.0 247.9 265.6 283.8 293.2 316.9 328.2<br />
Money market fund shares 25.1 -6.4 -20.2 -17.5 0.3 25.7 44.7 42.9<br />
Debt securities 2) -40.3 8.0 -20.1 14.0 17.6 26.9 16.8 27.7<br />
Long-term assets 311.0 342.3 443.3 359.7 303.1 257.9 222.5 157.7<br />
Deposits -5.7 33.7 -10.1 -0.3 -6.7 -19.7 -29.3 -34.1<br />
Debt securities 25.8 65.8 17.0 69.1 62.4 46.4 29.7 -2.0<br />
Shares and other equity 59.9 -8.5 136.1 -7.3 -29.7 -26.3 -32.8 -32.5<br />
Quoted, unquoted shares and other equity 7.6 -13.5 61.4 -8.7 -1.4 30.2 32.2 38.0<br />
Mutual fund shares 52.2 5.0 74.7 1.5 -28.3 -56.5 -65.0 -70.6<br />
Life insurance and pension fund reserves 231.0 251.3 300.4 298.2 277.1 257.4 254.8 226.3<br />
Main items of financing (-)<br />
Loans 262.8 311.7 390.3 411.4 390.7 382.4 364.6 361.6<br />
of which from euro area MFIs 211.6 280.8 358.3 372.1 346.5 337.2 316.8 302.3<br />
Other changes in financial assets (+)<br />
Shares and other equity 272.5 256.5 521.4 353.8 460.0 371.4 587.4 196.1<br />
Life insurance and pension fund reserves 29.0 56.9 129.4 55.0 48.5 33.4 66.1 29.8<br />
Remaining net flows (+) -55.5 -12.5 -73.8 -62.9 -57.4 -50.7 -92.9 -36.0<br />
= Changes in net worth 1) 713.2 769.5 1,078.9 825.8 941.9 863.7 1,092.9 684.8<br />
Financial balance sheet<br />
Financial assets (+)<br />
Short-term assets 4,058.0 4,275.7 4,494.8 4,644.7 4,751.6 4,830.1 4,969.5 5,020.9<br />
Currency and deposits 3,710.1 3,926.0 4,176.7 4,318.2 4,456.5 4,497.3 4,613.3 4,653.9<br />
Money market fund shares 321.0 313.9 300.5 285.4 261.3 281.0 305.0 302.8<br />
Debt securities 2) 27.0 35.7 17.6 41.2 33.8 51.8 51.2 64.3<br />
Long-term assets 9,214.9 9,847.5 10,931.5 11,483.6 11,761.0 11,981.2 12,081.2 11,863.0<br />
Deposits 841.9 876.6 883.9 870.9 871.0 847.8 836.3 830.9<br />
Debt securities 1,202.1 1,243.3 1,239.6 1,286.8 1,286.5 1,301.8 1,256.5 1,261.1<br />
Shares and other equity 3,629.8 3,878.4 4,529.1 4,808.2 4,999.0 5,160.4 5,241.1 4,997.3<br />
Quoted, unquoted shares and other equity 2,480.8 2,712.8 3,207.9 3,462.0 3,613.6 3,775.6 3,842.6 3,634.2<br />
Mutual fund shares 1,149.1 1,165.6 1,321.2 1,346.2 1,385.4 1,384.8 1,398.5 1,363.1<br />
Life insurance and pension fund reserves 3,541.0 3,849.2 4,278.9 4,517.6 4,604.6 4,671.1 4,747.3 4,773.7<br />
Remaining net assets (+) 190.2 228.0 184.0 203.9 202.6 215.0 207.8 219.8<br />
Liabilities (-)<br />
Loans 3,922.2 4,245.6 4,630.0 4,915.9 5,015.6 5,099.1 5,195.5 5,275.2<br />
of which from euro area MFIs 3,521.2 3,812.5 4,195.9 4,464.5 4,543.0 4,611.3 4,692.7 4,752.9<br />
= Net financial wealth 9,540.8 10,105.6 10,980.3 11,416.3 11,699.7 11,927.2 12,063.0 11,828.5<br />
Sources: ECB and Eurostat.<br />
1) Excluding changes in net worth due to other changes in non-financial assets such as revaluations of residential property.<br />
2) Securities issued by MFIs with a maturity of less than two years and by other sectors with a maturity of less than one year.<br />
S 32 ECB<br />
<strong>Monthly</strong> <strong>Bulletin</strong><br />
<strong>April</strong> <strong>2008</strong>


