

Monthly Bulletin April 2008 - European Central Bank - Europa
Monthly Bulletin April 2008 - European Central Bank - Europa
Monthly Bulletin April 2008 - European Central Bank - Europa

Create successful ePaper yourself
Turn your PDF publications into a flip-book with our unique Google optimized e-Paper software.
LATIN AMERICA<br />
In Latin America, economic activity continued to expand at a fast pace, driven by robust domestic<br />
demand and elevated commodity prices. In Brazil, real GDP growth increased to an annual rate<br />
of 6.1% in the fourth quarter of 2007, up from 5.6% in the third quarter. Private consumption and<br />
investment were the main drivers of growth. Moreover, private consumption continued to be strong<br />
in January of this year, with retail sales rising by 10.9% compared with a year earlier. Activity also<br />
remained robust in Argentina, where real GDP expanded by 9.2% compared with a year earlier in<br />
the fourth quarter of 2007. Inflationary pressures remained strong, however, with annual inflation at<br />
8.4% in February <strong>2008</strong>. In Mexico, industrial production rebounded in January, increasing by 3.1%<br />
compared with a year earlier. Annual inflation stood at 3.7% in February, broadly unchanged since<br />
December.<br />
1.2 COMMODITY MARKETS<br />
Against the background of tight fundamentals, oil prices reached historically high levels and became<br />
increasingly volatile in March and early <strong>April</strong> amid financial market uncertainties and geopolitical<br />
tensions. Brent crude oil prices increased to peaks well above USD 100 in mid-March (peak on 17<br />
March: USD 107.4) to stand at a level of USD 106.5 on 9 <strong>April</strong>. In USD terms oil prices increased<br />
by around 13% between the beginning of the year and 9 <strong>April</strong>, but by only around 5% in euro terms.<br />
OPEC decided not to increase production at its meeting on 5 March and scheduled the next meeting<br />
for September, underlining its intention to keep production constant despite the high oil prices and<br />
relatively robust demand. In addition, non-OPEC production continued to fall short of expectations.<br />
Geopolitical tensions and an explosion of a pipeline in Iraq resulted in additional upward pressure<br />
on oil prices. The International Energy Agency’s (IEA) assessment points to tight supply-demand<br />
balances for <strong>2008</strong>. After revising downwards their global oil demand forecast at the beginning of<br />
the year, owing to an expected slowdown in OECD economies, the IEA still predicts a pick-up in<br />
oil demand growth in <strong>2008</strong>, driven mainly by strong non-OECD demand.<br />
Limited spare capacity in OPEC countries and<br />
sluggish growth in non-OPEC output, amid<br />
relatively robust oil demand and continued<br />
geopolitical and supply risks, is likely to keep<br />
oil prices at elevated levels. Throughout the<br />
recent period of high volatility of spot prices and<br />
despite market concerns about a global economic<br />
slowdown, longer-term futures prices for Brent<br />
crude oil have increased to unprecedented levels,<br />
with December 2010 futures currently trading at<br />
around USD 100.<br />
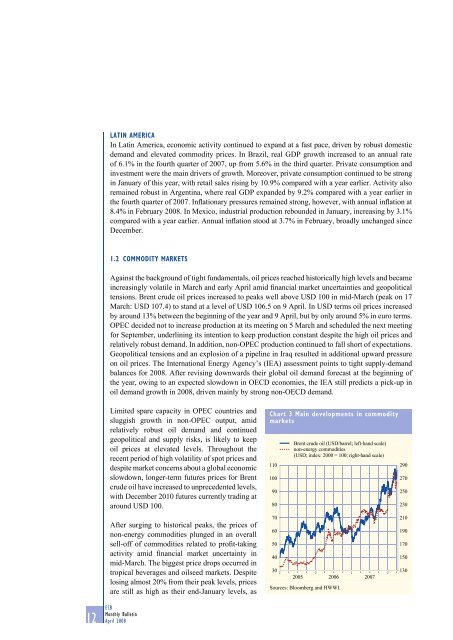
Chart 3 Main developments in commodity<br />
markets<br />
110<br />
100<br />
90<br />
80<br />
Brent crude oil (USD/barrel; left-hand scale)<br />
non-energy commodities<br />
(USD; index: 2000 = 100; right-hand scale)<br />
290<br />
270<br />
250<br />
230<br />
After surging to historical peaks, the prices of<br />
non-energy commodities plunged in an overall<br />
sell-off of commodities related to profit-taking<br />
activity amid financial market uncertainty in<br />
mid-March. The biggest price drops occurred in<br />
tropical beverages and oilseed markets. Despite<br />
losing almost 20% from their peak levels, prices<br />
are still as high as their end-January levels, as<br />
12 ECB<br />
<strong>Monthly</strong> <strong>Bulletin</strong><br />
<strong>April</strong> <strong>2008</strong><br />
70<br />
60<br />
50<br />
40<br />
30<br />
2005 2006 2007<br />
Sources: Bloomberg and HWWI.<br />
210<br />
190<br />
170<br />
150<br />
130


