

Monthly Bulletin April 2008 - European Central Bank - Europa
Monthly Bulletin April 2008 - European Central Bank - Europa
Monthly Bulletin April 2008 - European Central Bank - Europa

You also want an ePaper? Increase the reach of your titles
YUMPU automatically turns print PDFs into web optimized ePapers that Google loves.
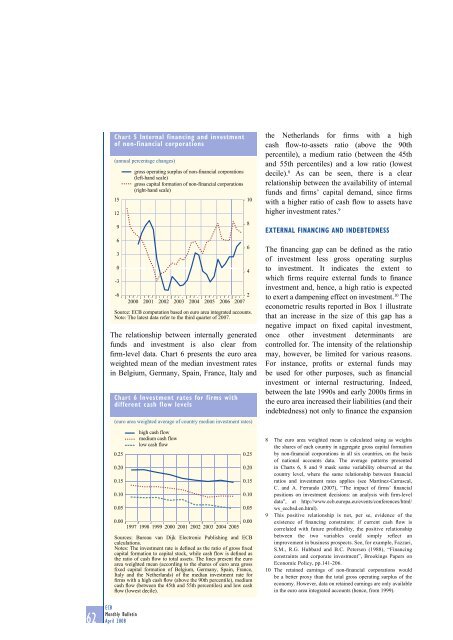
Chart 5 Internal financing and investment<br />
of non-financial corporations<br />
(annual percentage changes)<br />
15<br />
12<br />
9<br />
6<br />
3<br />
0<br />
-3<br />
-6<br />
gross operating surplus of non-financial corporations<br />
(left-hand scale)<br />
gross capital formation of non-financial corporations<br />
(right-hand scale)<br />
2<br />
2000 2001 2002 2003 2004 2005 2006 2007<br />
Source: ECB computation based on euro area integrated accounts.<br />
Note: The latest data refer to the third quarter of 2007.<br />
The relationship between internally generated<br />
funds and investment is also clear from<br />
firm-level data. Chart 6 presents the euro area<br />
weighted mean of the median investment rates<br />
in Belgium, Germany, Spain, France, Italy and<br />
Chart 6 Investment rates for firms with<br />
different cash flow levels<br />
(euro area weighted average of country median investment rates)<br />
0.25<br />
0.20<br />
0.15<br />
0.10<br />
0.05<br />
high cash flow<br />
medium cash flow<br />
low cash flow<br />
10<br />
8<br />
6<br />
4<br />
0.25<br />
0.20<br />
0.15<br />
0.10<br />
0.05<br />
0.00<br />
0.00<br />
1997 1998 1999 2000 2001 2002 2003 2004 2005<br />
Sources: Bureau van Dijk Electronic Publishing and ECB<br />
calculations.<br />
Notes: The investment rate is defined as the ratio of gross fixed<br />
capital formation to capital stock, while cash flow is defined as<br />
the ratio of cash flow to total assets. The lines present the euro<br />
area weighted mean (according to the shares of euro area gross<br />
fixed capital formation of Belgium, Germany, Spain, France,<br />
Italy and the Netherlands) of the median investment rate for<br />
firms with a high cash flow (above the 90th percentile), medium<br />
cash flow (between the 45th and 55th percentiles) and low cash<br />
flow (lowest decile).<br />
the Netherlands for firms with a high<br />
cash flow-to-assets ratio (above the 90th<br />
percentile), a medium ratio (between the 45th<br />
and 55th percentiles) and a low ratio (lowest<br />
decile). 8 As can be seen, there is a clear<br />
relationship between the availability of internal<br />
funds and firms’ capital demand, since firms<br />
with a higher ratio of cash flow to assets have<br />
higher investment rates. 9<br />
EXTERNAL FINANCING AND INDEBTEDNESS<br />
The financing gap can be defined as the ratio<br />
of investment less gross operating surplus<br />
to investment. It indicates the extent to<br />
which firms require external funds to finance<br />
investment and, hence, a high ratio is expected<br />
to exert a dampening effect on investment. 10 The<br />
econometric results reported in Box 1 illustrate<br />
that an increase in the size of this gap has a<br />
negative impact on fixed capital investment,<br />
once other investment determinants are<br />
controlled for. The intensity of the relationship<br />
may, however, be limited for various reasons.<br />
For instance, profits or external funds may<br />
be used for other purposes, such as financial<br />
investment or internal restructuring. Indeed,<br />
between the late 1990s and early 2000s firms in<br />
the euro area increased their liabilities (and their<br />
indebtedness) not only to finance the expansion<br />
8 The euro area weighted mean is calculated using as weights<br />
the shares of each country in aggregate gross capital formation<br />
by non-financial corporations in all six countries, on the basis<br />
of national accounts data. The average patterns presented<br />
in Charts 6, 8 and 9 mask some variability observed at the<br />
country level, where the same relationship between financial<br />
ratios and investment rates applies (see Martínez-Carrascal,<br />
C. and A. Ferrando (2007), “The impact of firms’ financial<br />
positions on investment decisions: an analysis with firm-level<br />
data”, at http://www.ecb.europa.eu/events/conferences/html/<br />
ws_eccbsd.en.html).<br />
9 This positive relationship is not, per se, evidence of the<br />
existence of financing constraints: if current cash flow is<br />
correlated with future profitability, the positive relationship<br />
between the two variables could simply reflect an<br />
improvement in business prospects. See, for example, Fazzari,<br />
S.M., R.G. Hubbard and B.C. Petersen (1988), “Financing<br />
constraints and corporate investment”, Brookings Papers on<br />
Economic Policy, pp.141-206.<br />
10 The retained earnings of non-financial corporations would<br />
be a better proxy than the total gross operating surplus of the<br />
economy. However, data on retained earnings are only available<br />
in the euro area integrated accounts (hence, from 1999).<br />
62 ECB<br />
<strong>Monthly</strong> <strong>Bulletin</strong><br />
<strong>April</strong> <strong>2008</strong>


