2 MONEY, BANKING AND INVESTMENT FUNDS 2.1 Aggregated balance sheet of euro area MFIs 1) (EUR billions; outstanding amounts at end of period) 1. Assets Total Loans to euro area residents Holdings of securities other than Money Holdings External Fixed Remaining shares issued by euro area residents market of shares/ assets assets assets fund other equity Total General Other MFIs Total General Other MFIs shares/ issued by government euro area government euro area units 2) euro area residents residents residents 1 2 3 4 5 6 7 8 9 10 11 12 13 14 Eurosystem 2005 1,404.9 635.5 20.7 0.6 614.2 185.7 165.6 2.1 18.1 - 14.8 337.0 14.7 217.2 2006 1,558.2 695.7 19.7 0.6 675.3 217.0 187.5 2.5 27.0 - 17.2 351.4 14.7 262.4 2007 Q1 1,576.7 693.3 19.7 0.6 673.0 238.0 205.5 2.1 30.4 - 17.4 359.6 14.8 253.6 Q2 1,651.5 751.5 17.7 0.6 733.1 249.8 213.2 2.2 34.3 - 17.8 354.1 15.4 263.0 Q3 1,707.3 753.5 17.8 0.6 735.1 259.5 219.3 2.2 38.0 - 17.7 368.8 15.6 292.3 2007 Oct. 1,781.8 800.2 17.8 0.6 781.8 262.3 220.4 2.2 39.8 - 17.9 378.1 15.6 307.6 Nov. 1,805.1 814.3 17.8 0.6 795.9 266.9 223.3 2.1 41.6 - 17.6 367.9 15.6 322.8 Dec. 2,046.1 1,031.7 17.8 0.6 1,013.3 268.6 225.1 1.9 41.6 - 17.4 373.7 15.2 339.6 <strong>2008</strong> Jan. 1,934.2 886.8 19.4 0.7 866.7 273.5 230.2 2.0 41.3 - 16.3 401.3 15.4 341.1 Feb. (p) 1,954.2 901.3 19.4 0.7 881.2 277.3 233.6 2.2 41.5 - 16.6 400.4 15.3 343.3 MFIs excluding the Eurosystem 2005 23,631.5 13,681.7 826.9 8,285.1 4,569.7 3,498.6 1,429.4 551.5 1,517.7 83.1 1,008.7 3,652.8 165.7 1,540.9 2006 25,974.6 14,904.3 810.5 9,160.3 4,933.5 3,555.4 1,276.5 645.9 1,632.9 83.5 1,194.5 4,330.4 172.6 1,733.9 2007 Q1 27,107.8 15,340.0 801.4 9,441.0 5,097.6 3,661.0 1,282.2 685.8 1,693.0 92.4 1,244.5 4,684.7 195.1 1,890.1 Q2 28,066.3 15,775.4 798.2 9,712.6 5,264.5 3,759.6 1,281.6 761.5 1,716.4 96.6 1,273.9 4,888.4 201.7 2,070.9 Q3 28,476.3 16,172.0 793.0 9,948.6 5,430.4 3,748.7 1,215.1 805.1 1,728.5 95.9 1,257.2 4,878.5 203.1 2,120.9 2007 Oct. 29,163.6 16,554.4 944.0 10,027.4 5,583.0 3,833.7 1,214.0 878.2 1,741.4 98.6 1,307.9 4,987.6 216.6 2,164.9 Nov. 29,442.5 16,723.6 944.9 10,110.1 5,668.6 3,850.9 1,212.2 892.6 1,746.0 99.2 1,296.4 5,023.4 215.4 2,233.6 Dec. 29,397.0 16,887.0 956.1 10,154.1 5,776.9 3,882.8 1,194.2 951.9 1,736.6 93.3 1,311.4 4,874.7 206.8 2,141.0 <strong>2008</strong> Jan. 30,047.1 17,109.1 961.0 10,295.7 5,852.3 3,974.3 1,219.9 962.3 1,792.1 98.1 1,315.3 5,091.4 206.3 2,252.7 Feb. (p) 30,207.3 17,141.2 953.2 10,351.9 5,836.0 4,023.2 1,216.8 981.2 1,825.1 102.7 1,302.6 5,133.4 201.3 2,302.9 2. Liabilities Total Currency Deposits of euro area residents Money Debt Capital External Remaining in market securities and liabilities liabilities circulation Total <strong>Central</strong> Other general MFIs fund issued 4) reserves government government/ shares/ other euro units 3) area residents 1 2 3 4 5 6 7 8 9 10 11 Eurosystem 2005 1,404.9 582.7 385.4 24.4 14.5 346.5 - 0.1 202.9 27.6 206.2 2006 1,558.2 647.0 431.6 33.7 15.9 382.0 - 0.1 208.6 35.3 235.6 2007 Q1 1,576.7 632.7 455.6 44.8 17.5 393.3 - 0.3 216.3 39.5 232.4 Q2 1,651.5 652.6 495.2 51.2 23.3 420.7 - 0.1 207.0 51.0 245.6 Q3 1,707.3 657.2 510.7 51.7 19.1 439.9 - 0.1 222.6 48.3 268.4 2007 Oct. 1,781.8 661.9 561.6 54.9 22.9 483.8 - 0.1 228.7 51.8 277.7 Nov. 1,805.1 665.5 570.0 48.2 24.1 497.7 - 0.1 226.0 53.9 289.6 Dec. 2,046.1 697.0 714.7 23.9 19.1 671.8 - 0.1 238.0 66.0 330.3 <strong>2008</strong> Jan. 1,934.2 671.3 626.6 54.6 21.0 551.1 - 0.1 254.5 72.9 308.9 Feb. (p) 1,954.2 674.2 650.5 48.1 23.3 579.0 - 0.1 259.2 58.3 311.9 MFIs excluding the Eurosystem 2005 23,631.5 - 12,212.2 149.2 7,211.9 4,851.2 698.9 3,858.3 1,310.6 3,518.0 2,033.5 2006 25,974.6 - 13,257.2 124.2 7,890.6 5,242.4 698.3 4,247.6 1,449.7 3,991.1 2,330.6 2007 Q1 27,107.8 - 13,595.8 139.0 8,060.9 5,395.9 758.7 4,424.8 1,529.7 4,255.7 2,543.1 Q2 28,066.3 - 14,021.0 169.8 8,278.3 5,572.9 795.6 4,523.4 1,551.2 4,451.8 2,723.2 Q3 28,476.3 - 14,250.3 144.3 8,408.9 5,697.1 778.4 4,577.2 1,589.5 4,525.8 2,755.1 2007 Oct. 29,163.6 - 14,624.8 129.4 8,631.1 5,864.2 782.9 4,648.2 1,643.3 4,630.9 2,833.6 Nov. 29,442.5 - 14,803.3 151.6 8,692.3 5,959.4 796.2 4,649.5 1,641.0 4,641.2 2,911.3 Dec. 29,397.0 - 15,076.7 128.4 8,859.9 6,088.4 754.1 4,643.5 1,678.2 4,529.3 2,715.3 <strong>2008</strong> Jan. 30,047.1 - 15,182.1 114.2 8,925.7 6,142.1 835.5 4,684.7 1,698.7 4,795.1 2,851.0 Feb. (p) 30,207.3 - 15,214.8 137.8 8,939.8 6,137.2 853.1 4,682.7 1,702.8 4,862.0 2,891.9 Source: ECB. 1) Data refer to the changing composition of the euro area. For further information, see the General notes. 2) Amounts issued by euro area residents. Amounts issued by non-euro area residents are included in external assets. 3) Amounts held by euro area residents. 4) Amounts issued with maturity up to two years held by non-euro area residents are included in external liabilities. S 10 ECB <strong>Monthly</strong> <strong>Bulletin</strong> <strong>April</strong> <strong>2008</strong>
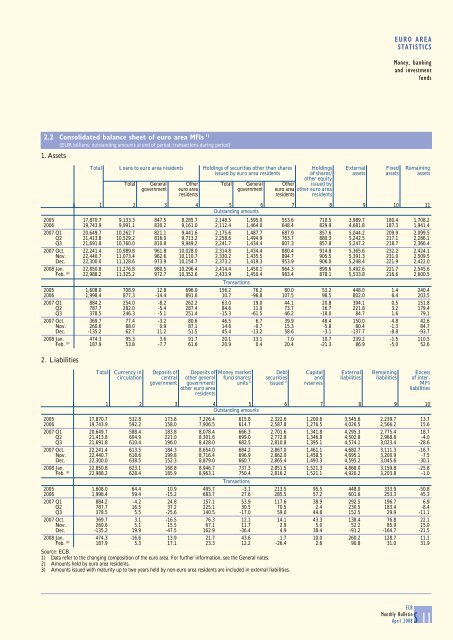
EURO AREA STATISTICS Money, banking and investment funds 2.2 Consolidated balance sheet of euro area MFIs 1) (EUR billions; outstanding amounts at end of period; transactions during period) 1. Assets Total Loans to euro area residents Holdings of securities other than shares Holdings External Fixed Remaining issued by euro area residents of shares/ assets assets assets other equity Total General Other Total General Other issued by government euro area government euro area other euro area residents residents residents 1 2 3 4 5 6 7 8 9 10 11 Outstanding amounts 2005 17,870.7 9,133.3 847.5 8,285.7 2,148.5 1,595.0 553.6 710.5 3,989.7 180.4 1,708.2 2006 19,743.9 9,991.1 830.2 9,161.0 2,112.4 1,464.0 648.4 829.9 4,681.8 187.3 1,941.4 2007 Q1 20,649.7 10,262.7 821.1 9,441.6 2,175.6 1,487.7 687.9 857.6 5,044.2 209.9 2,099.5 Q2 21,413.8 10,529.2 816.0 9,713.2 2,258.6 1,494.9 763.7 880.3 5,242.5 217.1 2,286.1 Q3 21,691.8 10,760.0 810.8 9,949.2 2,241.7 1,434.4 807.3 857.8 5,247.2 218.7 2,366.4 2007 Oct. 22,241.4 10,989.8 961.8 10,028.0 2,314.8 1,434.4 880.4 914.8 5,365.6 232.2 2,424.1 Nov. 22,440.7 11,073.4 962.6 10,110.7 2,330.2 1,435.5 894.7 905.5 5,391.3 231.0 2,509.5 Dec. 22,300.0 11,128.6 973.9 10,154.7 2,373.2 1,419.3 953.9 906.0 5,248.4 221.9 2,422.0 <strong>2008</strong> Jan. 22,850.8 11,276.8 980.5 10,296.4 2,414.4 1,450.1 964.3 899.6 5,492.6 221.7 2,545.6 Feb. (p) 22,988.2 11,325.2 972.7 10,352.6 2,433.9 1,450.4 983.4 878.1 5,533.8 216.6 2,600.5 Transactions 2005 1,608.0 708.9 12.8 696.0 156.2 76.2 80.0 53.2 448.0 1.4 240.4 2006 1,998.4 877.3 -14.4 891.6 10.7 -96.8 107.5 98.5 802.0 6.4 203.5 2007 Q1 884.2 254.0 -8.2 262.2 63.0 19.0 44.1 20.8 394.1 0.5 151.8 Q2 787.7 282.0 -5.4 287.4 84.6 11.0 73.7 16.7 221.8 3.2 179.4 Q3 378.5 246.3 -5.1 251.4 -15.3 -61.5 46.2 -18.0 84.7 1.6 79.1 2007 Oct. 369.7 77.4 -3.2 80.6 46.5 6.7 39.9 48.4 150.0 4.8 42.6 Nov. 260.6 88.0 0.9 87.1 14.6 -0.7 15.3 -5.8 80.4 -1.3 84.7 Dec. -135.2 62.7 11.2 51.5 45.4 -13.2 58.6 -3.1 -137.7 -8.8 -93.7 <strong>2008</strong> Jan. 474.3 95.3 3.6 91.7 20.1 13.1 7.0 10.7 239.2 -1.5 110.5 Feb. (p) 187.9 53.8 -7.7 61.6 20.9 0.4 20.4 -21.3 86.9 -5.0 52.6 2. Liabilities Total Currency in Deposits of Deposits of Money market Debt Capital External Remaining Excess circulation central other general fund shares/ securities and liabilities liabilities of intergovernment government/ units 2) issued 3) reserves MFI other euro area liabilities residents 1 2 3 4 5 6 7 8 9 10 Outstanding amounts 2005 17,870.7 532.8 173.6 7,226.4 615.8 2,322.6 1,200.6 3,545.6 2,239.7 13.7 2006 19,743.9 592.2 158.0 7,906.5 614.7 2,587.8 1,276.5 4,026.5 2,566.2 15.6 2007 Q1 20,649.7 588.4 183.8 8,078.4 666.3 2,701.6 1,341.8 4,295.3 2,775.4 18.7 Q2 21,413.8 604.9 221.0 8,301.6 699.0 2,772.8 1,346.8 4,502.8 2,968.8 -4.0 Q3 21,691.8 610.4 196.0 8,428.0 682.5 2,810.8 1,395.1 4,574.1 3,023.4 -28.6 2007 Oct. 22,241.4 613.5 184.3 8,654.0 684.2 2,867.0 1,461.1 4,682.7 3,111.3 -16.7 Nov. 22,440.7 618.6 199.8 8,716.4 696.9 2,862.0 1,458.5 4,695.1 3,200.9 -7.5 Dec. 22,300.0 638.5 152.3 8,879.0 660.7 2,865.4 1,493.3 4,595.2 3,045.6 -30.1 <strong>2008</strong> Jan. 22,850.8 623.1 168.8 8,946.7 737.3 2,851.5 1,521.3 4,868.0 3,159.8 -25.8 Feb. (p) 22,988.2 628.4 185.9 8,963.1 750.4 2,816.2 1,521.1 4,920.2 3,203.8 -1.0 Transactions 2005 1,608.0 64.4 10.9 495.7 -3.1 213.5 95.5 448.0 333.9 -50.8 2006 1,998.4 59.4 -15.2 683.7 27.6 285.5 57.2 601.6 253.3 45.3 2007 Q1 884.2 -4.2 24.8 157.1 53.9 117.6 38.9 292.5 196.7 6.9 Q2 787.7 16.5 37.2 225.1 30.5 70.5 2.4 230.5 183.4 -8.4 Q3 378.5 5.5 -25.6 140.5 -17.0 59.0 44.8 152.5 29.9 -11.1 2007 Oct. 369.7 3.1 -16.5 76.3 12.1 14.1 43.3 138.4 76.8 22.1 Nov. 260.6 5.1 15.5 67.1 11.7 2.9 5.0 52.2 85.9 15.0 Dec. -135.2 19.9 -47.5 162.9 -36.4 4.9 38.4 -91.2 -164.7 -21.5 <strong>2008</strong> Jan. 474.3 -16.6 13.9 21.7 43.6 1.7 10.0 260.2 128.7 11.1 Feb. (p) 187.9 5.3 17.1 23.3 12.2 -26.4 2.6 90.8 31.0 31.9 Source: ECB. 1) Data refer to the changing composition of the euro area. For further information, see the General notes. 2) Amounts held by euro area residents. 3) Amounts issued with maturity up to two years held by non-euro area residents are included in external liabilities. ECB <strong>Monthly</strong> <strong>Bulletin</strong> <strong>April</strong> <strong>2008</strong>S 11
- Page 1 and 2:
EN EUROPEAN CENTRAL BANK MONTHLY BU
- Page 3 and 4:
© European Central Bank 2008 Addre
- Page 5 and 6:
ABBREVIATIONS COUNTRIES LU Luxembou
- Page 7 and 8:
months, moderating only gradually o
- Page 10 and 11:
ECONOMIC AND MONETARY DEVELOPMENTS
- Page 12 and 13:
ECONOMIC AND MONETARY DEVELOPMENTS
- Page 14 and 15:
ECONOMIC AND MONETARY DEVELOPMENTS
- Page 16 and 17:
ECONOMIC AND MONETARY DEVELOPMENTS
- Page 18 and 19:
ECONOMIC AND MONETARY DEVELOPMENTS
- Page 20 and 21:
ECONOMIC AND MONETARY DEVELOPMENTS
- Page 22 and 23:
ECONOMIC AND MONETARY DEVELOPMENTS
- Page 24 and 25:
ECONOMIC AND MONETARY DEVELOPMENTS
- Page 26 and 27:
ECONOMIC AND MONETARY DEVELOPMENTS
- Page 28 and 29:
ECONOMIC AND MONETARY DEVELOPMENTS
- Page 30 and 31:
ECONOMIC AND MONETARY DEVELOPMENTS
- Page 32 and 33:
ECONOMIC AND MONETARY DEVELOPMENTS
- Page 34 and 35:
ECONOMIC AND MONETARY DEVELOPMENTS
- Page 36 and 37:
ECONOMIC AND MONETARY DEVELOPMENTS
- Page 38 and 39:
ECONOMIC AND MONETARY DEVELOPMENTS
- Page 40 and 41:
ECONOMIC AND MONETARY DEVELOPMENTS
- Page 42 and 43:
ECONOMIC AND MONETARY DEVELOPMENTS
- Page 44 and 45:
ECONOMIC AND MONETARY DEVELOPMENTS
- Page 46 and 47:
ECONOMIC AND MONETARY DEVELOPMENTS
- Page 48 and 49: ECONOMIC AND MONETARY DEVELOPMENTS
- Page 50 and 51: ECONOMIC AND MONETARY DEVELOPMENTS
- Page 52 and 53: ECONOMIC AND MONETARY DEVELOPMENTS
- Page 54 and 55: ECONOMIC AND MONETARY DEVELOPMENTS
- Page 56 and 57: ECONOMIC AND MONETARY DEVELOPMENTS
- Page 58 and 59: ARTICLES BUSINESS INVESTMENT IN THE
- Page 60 and 61: Thereafter, in the early part of th
- Page 62 and 63: from an investment project in order
- Page 64 and 65: of fixed capital investment, but al
- Page 66 and 67: ARTICLES of 2007. However, as monet
- Page 68 and 69: ARTICLES Relationship between inves
- Page 70 and 71: SHORT-TERM FORECASTS OF ECONOMIC AC
- Page 72 and 73: designed to extract the common move
- Page 74 and 75: Chart 2 Evolution of GDP forecast p
- Page 76 and 77: DEVELOPMENTS IN THE EU ARRANGEMENTS
- Page 78 and 79: ability to deliver results, and pro
- Page 80 and 81: anking acts in line with the spirit
- Page 82 and 83: There is a close interrelationship
- Page 84 and 85: ARTICLES 2. In a crisis situation,
- Page 86 and 87: the role of the consolidating super
- Page 88 and 89: The ECB strongly supports the initi
- Page 91 and 92: CONTENTS 1 EURO AREA OVERVIEW Summa
- Page 93 and 94: EURO AREA OVERVIEW Summary of econo
- Page 95 and 96: EURO AREA STATISTICS Monetary polic
- Page 97: EURO AREA STATISTICS Monetary polic
- Page 101 and 102: EURO AREA STATISTICS Money, banking
- Page 103 and 104: EURO AREA STATISTICS Money, banking
- Page 105 and 106: EURO AREA STATISTICS Money, banking
- Page 107 and 108: EURO AREA STATISTICS Money, banking
- Page 109 and 110: EURO AREA STATISTICS Money, banking
- Page 111 and 112: EURO AREA STATISTICS Money, banking
- Page 113 and 114: EURO AREA STATISTICS Money, banking
- Page 115 and 116: EURO AREA STATISTICS Euro area acco
- Page 117 and 118: EURO AREA STATISTICS Euro area acco
- Page 119 and 120: EURO AREA STATISTICS Euro area acco
- Page 121 and 122: EURO AREA STATISTICS Euro area acco
- Page 123 and 124: FINANCIAL MARKETS 4 4.1 Securities,
- Page 125 and 126: EURO AREA STATISTICS Financial mark
- Page 127 and 128: EURO AREA STATISTICS Financial mark
- Page 129 and 130: EURO AREA STATISTICS Financial mark
- Page 131 and 132: EURO AREA STATISTICS Financial mark
- Page 133 and 134: EURO AREA STATISTICS Financial mark
- Page 135 and 136: PRICES, OUTPUT, DEMAND AND LABOUR M
- Page 137 and 138: EURO AREA STATISTICS Prices, output
- Page 139 and 140: EURO AREA STATISTICS Prices, output
- Page 141 and 142: EURO AREA STATISTICS Prices, output
- Page 143 and 144: GOVERNMENT FINANCE 6 6.1 Revenue, e
- Page 145 and 146: EURO AREA STATISTICS Government fin
- Page 147 and 148: EURO AREA STATISTICS Government fin
- Page 149 and 150:
EURO AREA STATISTICS External trans
- Page 151 and 152:
EURO AREA STATISTICS External trans
- Page 153 and 154:
EURO AREA STATISTICS External trans
- Page 155 and 156:
EURO AREA STATISTICS External trans
- Page 157 and 158:
EURO AREA STATISTICS External trans
- Page 159 and 160:
EURO AREA STATISTICS External trans
- Page 161 and 162:
EURO AREA STATISTICS Exchange rates
- Page 163 and 164:
EURO AREA STATISTICS Developments o
- Page 165 and 166:
TECHNICAL NOTES RELATING TO THE EUR
- Page 167 and 168:
EURO AREA STATISTICS Technical note
- Page 169:
EURO AREA STATISTICS Technical note
- Page 172 and 173:
OVERVIEW Developments in key indica
- Page 174 and 175:
EURO AREA ACCOUNTS Section 3.1 show
- Page 176 and 177:
seasonally adjusted growth rates ha
- Page 178 and 179:
using harmonised criteria and defin
- Page 180 and 181:
statistics, such as the MFI consoli
- Page 183 and 184:
ANNEXES CHRONOLOGY OF MONETARY POLI
- Page 185:
CHRONOLOGY 5 JULY, 2 AUGUST, 6 SEPT
- Page 188 and 189:
“Globalisation, trade and the eur
- Page 190 and 191:
853 “The cyclical behaviour of eq
- Page 192 and 193:
“Bond markets and long-term inter
- Page 194 and 195:
Debt (general government): the gros
- Page 196 and 197:
Fixed rate tender: a tender procedu
- Page 198 and 199:
MFI interest rates: the interest ra