view - Department of Reproduction, Obstetrics and Herd Health
view - Department of Reproduction, Obstetrics and Herd Health
view - Department of Reproduction, Obstetrics and Herd Health

You also want an ePaper? Increase the reach of your titles
YUMPU automatically turns print PDFs into web optimized ePapers that Google loves.
GENERAL DISCUSSION<br />
An increased BHBA level has been shown in cows >63 DIM during MFD (Bernal-<br />
Santos et al., 2003). As shown in Table 2, until now only 1 study has been able to<br />
successfully ameliorate the metabolic energy status in early lactating dairy cows (Odens<br />
et al., 2007). More recent studies have however reported an unexplained lower body<br />
weight increase (Moallem et al., 2010) <strong>and</strong> lower back-fat thickness (von Soosten et al.,<br />
2011) during MFD. Castaneda-Gutiérrez et al. (2007) were the first to demonstrate an<br />
increased IGF-I concentration in plasma during MFD, the latter being brought forward<br />
to explain the overall improved reproductive performance in the multi-study analysis<br />
from de Veth et al. (2009) on trans-10, cis-12 CLA supplementation. The approach <strong>of</strong><br />
altered signaling metabolites such as IGF-I was suggested to explain enhanced<br />
reproduction as new studies failed to repeat the results <strong>of</strong> Odens et al. (2007) indicating<br />
an improved energetic status.<br />
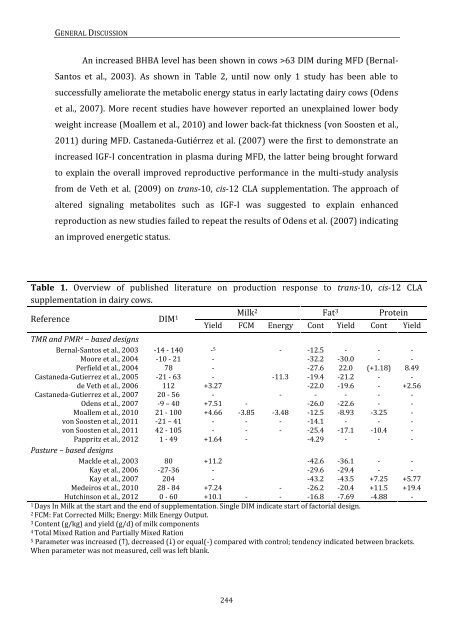
Table 1. Over<strong>view</strong> <strong>of</strong> published literature on production response to trans-10, cis-12 CLA<br />
supplementation in dairy cows.<br />
Reference DIM 1 Milk 2 Fat 3 Protein<br />
Yield FCM Energy Cont Yield Cont Yield<br />
TMR <strong>and</strong> PMR 4 – based designs<br />
Bernal-Santos et al., 2003 -14 - 140 - 5 - -12.5 - - -<br />
Moore et al., 2004 -10 - 21 - -32.2 -30.0 - -<br />
Perfield et al., 2004 78 - -27.6 22.0 (+1.18) 8.49<br />
Castaneda-Gutierrez et al., 2005 -21 - 63 - -11.3 -19.4 -21.2 - -<br />
de Veth et al., 2006 112 +3.27 -22.0 -19.6 - +2.56<br />
Castaneda-Gutierrez et al., 2007 20 - 56 - - - - - -<br />
Odens et al., 2007 -9 – 40 +7.51 - -26.0 -22.6 - -<br />
Moallem et al., 2010 21 - 100 +4.66 -3.85 -3.48 -12.5 -8.93 -3.25 -<br />
von Soosten et al., 2011 -21 – 41 - - - -14.1 - - -<br />
von Soosten et al., 2011 42 - 105 - - - -25.4 -17.1 -10.4 -<br />
Pappritz et al., 2012 1 - 49 +1.64 - -4.29 - - -<br />
Pasture – based designs<br />
Mackle et al., 2003 80 +11.2 -42.6 -36.1 - -<br />
Kay et al., 2006 -27-36 - -29.6 -29.4 - -<br />
Kay et al., 2007 204 - -43.2 -43.5 +7.25 +5.77<br />
Medeiros et al., 2010 28 - 84 +7.24 - -26.2 -20.4 +11.5 +19.4<br />
Hutchinson et al., 2012 0 - 60 +10.1 - - -16.8 -7.69 -4.88 -<br />
1 Days In Milk at the start <strong>and</strong> the end <strong>of</strong> supplementation. Single DIM indicate start <strong>of</strong> factorial design.<br />
2 FCM: Fat Corrected Milk; Energy: Milk Energy Output.<br />
3 Content (g/kg) <strong>and</strong> yield (g/d) <strong>of</strong> milk components<br />
4 Total Mixed Ration <strong>and</strong> Partially Mixed Ration<br />
5 Parameter was increased (↑), decreased (↓) or equal(-) compared with control; tendency indicated between brackets.<br />
When parameter was not measured, cell was left blank.<br />
244