- Page 1 and 2:
Health and fertility challenges in
- Page 3 and 4:
Health and Fertility Challenges in
- Page 6:
TABLE OF CONTENTS LIST OF ABBREVIAT
- Page 10:
GENERAL INTRODUCTION Modified from:
- Page 13 and 14:
CHAPTER 1 Table 1. List of bioactiv
- Page 15 and 16:
Milk production per lactation (kg)
- Page 17 and 18:
CHAPTER 1 availability in the diet
- Page 19 and 20:
CHAPTER 1 Chagas, L. M., J. J. Bass
- Page 21 and 22:
CHAPTER 1 Goff, J. P. and R. L. Hor
- Page 23 and 24:
CHAPTER 1 Lucy, M. C. 2008. Functio
- Page 25:
CHAPTER 1 UNPD. 2010. World populat
- Page 30 and 31:
THE FABULOUS DESTINY OF FATTY ACIDS
- Page 32 and 33:
THE FABULOUS DESTINY OF FATTY ACIDS
- Page 34 and 35: THE FABULOUS DESTINY OF FATTY ACIDS
- Page 36 and 37: THE FABULOUS DESTINY OF FATTY ACIDS
- Page 38 and 39: Intestinal digestibility (%) THE FA
- Page 40 and 41: THE FABULOUS DESTINY OF FATTY ACIDS
- Page 42 and 43: THE FABULOUS DESTINY OF FATTY ACIDS
- Page 44 and 45: THE FABULOUS DESTINY OF FATTY ACIDS
- Page 46 and 47: THE FABULOUS DESTINY OF FATTY ACIDS
- Page 48 and 49: THE FABULOUS DESTINY OF FATTY ACIDS
- Page 50 and 51: THE FABULOUS DESTINY OF FATTY ACIDS
- Page 52 and 53: THE FABULOUS DESTINY OF FATTY ACIDS
- Page 54 and 55: THE FABULOUS DESTINY OF FATTY ACIDS
- Page 56 and 57: THE FABULOUS DESTINY OF FATTY ACIDS
- Page 58 and 59: THE FABULOUS DESTINY OF FATTY ACIDS
- Page 60 and 61: THE FABULOUS DESTINY OF FATTY ACIDS
- Page 64: AIMS
- Page 70: HEALTH CHALLENGES IN HIGH YIELDING
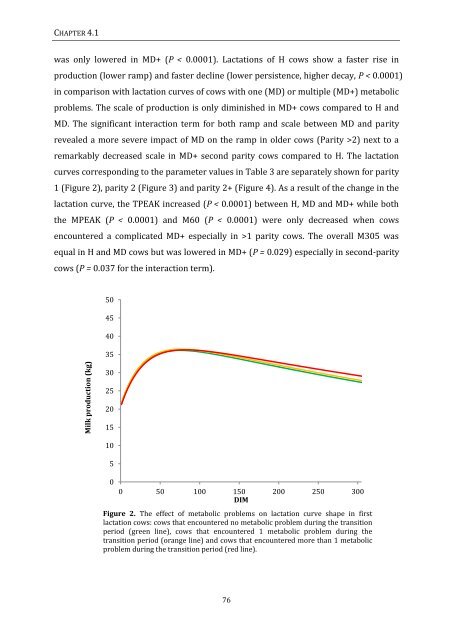
- Page 74: LACTATION CURVE ANALYSIS IN METABOL
- Page 77 and 78: CHAPTER 4.1 and interrelationships
- Page 79 and 80: CHAPTER 4.1 GmbH, Unterschleißheim
- Page 81 and 82: CHAPTER 4.1 analysis, all animals w
- Page 83: Survival distribution function CHAP
- Page 87 and 88: CHAPTER 4.1 Complicated twinning (T
- Page 89 and 90: CHAPTER 4.1 Table 5. The effect of
- Page 91 and 92: CHAPTER 4.1 Table 7. The effect of
- Page 93 and 94: CHAPTER 4.1 Table 8. The effect of
- Page 95 and 96: CHAPTER 4.1 Table 10. The effect of
- Page 97 and 98: CHAPTER 4.1 In most studies a posit
- Page 99 and 100: CHAPTER 4.1 reported a positive and
- Page 101 and 102: CHAPTER 4.1 ACKNOWLEDGEMENTS The au
- Page 103 and 104: CHAPTER 4.1 Detilleux, J. C., Y. T.
- Page 105 and 106: CHAPTER 4.1 Hosmer, D.W., and S. Le
- Page 107 and 108: CHAPTER 4.1 Rajala-Schultz, P. J.,
- Page 112: THE FATTY ACID PROFILE OF SUBCUTANE
- Page 116 and 117: THE FATTY ACID PROFILE OF SUBCUTANE
- Page 118 and 119: THE FATTY ACID PROFILE OF SUBCUTANE
- Page 120 and 121: THE FATTY ACID PROFILE OF SUBCUTANE
- Page 122 and 123: THE FATTY ACID PROFILE OF SUBCUTANE
- Page 124 and 125: Fatty acid (g/100 g FA) Fatty acid
- Page 126 and 127: THE FATTY ACID PROFILE OF SUBCUTANE
- Page 128 and 129: THE FATTY ACID PROFILE OF SUBCUTANE
- Page 130 and 131: THE FATTY ACID PROFILE OF SUBCUTANE
- Page 132 and 133: THE FATTY ACID PROFILE OF SUBCUTANE
- Page 134 and 135:
THE FATTY ACID PROFILE OF SUBCUTANE
- Page 138:
THE USE OF DIETARY FATTY ACIDS DURI
- Page 142 and 143:
FEEDING MARINE ALGAE TO DAIRY COWS
- Page 144 and 145:
FEEDING MARINE ALGAE TO DAIRY COWS
- Page 146 and 147:
FEEDING MARINE ALGAE TO DAIRY COWS
- Page 148 and 149:
FEEDING MARINE ALGAE TO DAIRY COWS
- Page 150 and 151:
FEEDING MARINE ALGAE TO DAIRY COWS
- Page 152 and 153:
FEEDING MARINE ALGAE TO DAIRY COWS
- Page 154 and 155:
FEEDING MARINE ALGAE TO DAIRY COWS
- Page 156 and 157:
FEEDING MARINE ALGAE TO DAIRY COWS
- Page 158 and 159:
FEEDING MARINE ALGAE TO DAIRY COWS
- Page 160 and 161:
FEEDING MARINE ALGAE TO DAIRY COWS
- Page 162 and 163:
FEEDING MARINE ALGAE TO DAIRY COWS
- Page 164 and 165:
FEEDING MARINE ALGAE TO DAIRY COWS
- Page 166 and 167:
FEEDING MARINE ALGAE TO DAIRY COWS
- Page 168:
FEEDING MARINE ALGAE TO DAIRY COWS
- Page 174:
FEEDING OMEGA-6 AND OMEGA-3 FATTY A
- Page 177 and 178:
CHAPTER 5.2 breeding period reduced
- Page 179 and 180:
CHAPTER 5.2 More specifically, the
- Page 181 and 182:
CHAPTER 5.2 The Flemish Veterinary
- Page 183 and 184:
CHAPTER 5.2 of milk and BCS and FA
- Page 185 and 186:
CHAPTER 5.2 Table 3. Effect of diet
- Page 187 and 188:
CHAPTER 5.2 Table 4. The effect of
- Page 189 and 190:
CHAPTER 5.2 Figure 2 (previous page
- Page 191 and 192:
FAME (g/100g) FAME (g/100g) CHAPTER
- Page 193 and 194:
CHAPTER 5.2 prepartum period. At th
- Page 195 and 196:
CHAPTER 5.2 IMPLICATIONS FOR FERTIL
- Page 197 and 198:
CHAPTER 5.2 REFERENCES AbuGhazaleh,
- Page 199 and 200:
CHAPTER 5.2 supplementation on syst
- Page 201 and 202:
CHAPTER 5.2 Lucy, M. C., C. R. Stap
- Page 203 and 204:
CHAPTER 5.2 Petit, H. V. and C. Ben
- Page 205:
CHAPTER 5.2 Zachut, M., A. Arieli,
- Page 210:
MILK FAT SATURATION AND REPRODUCTIV
- Page 214 and 215:
MILK FAT SATURATION AND REPRODUCTIV
- Page 216 and 217:
MILK FAT SATURATION AND REPRODUCTIV
- Page 218 and 219:
Protein content (g/kg) Fat content
- Page 220 and 221:
Estimated CRFI MILK FAT SATURATION
- Page 222 and 223:
DIMFI (d) CVUFA % MILK FAT SATURATI
- Page 224 and 225:
DIMCONC (d) CVUFA (%) MILK FAT SATU
- Page 226 and 227:
MILK FAT SATURATION AND REPRODUCTIV
- Page 228 and 229:
MILK FAT SATURATION AND REPRODUCTIV
- Page 230 and 231:
MILK FAT SATURATION AND REPRODUCTIV
- Page 232 and 233:
MILK FAT SATURATION AND REPRODUCTIV
- Page 234:
MILK FAT SATURATION AND REPRODUCTIV
- Page 240 and 241:
GENERAL DISCUSSION The scope of the
- Page 242 and 243:
GENERAL DISCUSSION (Hogeveen, 2012)
- Page 244 and 245:
Milk Production (kg) Milk Productio
- Page 246 and 247:
GENERAL DISCUSSION First, researche
- Page 248 and 249:
GENERAL DISCUSSION FATTY ACID MOBIL
- Page 250 and 251:
Omental Fat Score GENERAL DISCUSSIO
- Page 252 and 253:
GENERAL DISCUSSION The main objecti
- Page 254 and 255:
GENERAL DISCUSSION Even though some
- Page 256 and 257:
GENERAL DISCUSSION Table 2. Overvie
- Page 258 and 259:
GENERAL DISCUSSION Figure 4. Fatty
- Page 260 and 261:
GENERAL DISCUSSION and 22:6n-3 were
- Page 262 and 263:
GENERAL DISCUSSION IMPLICATIONS FOR
- Page 264 and 265:
GENERAL DISCUSSION We found a nega
- Page 266 and 267:
GENERAL DISCUSSION fatty acid compo
- Page 268 and 269:
GENERAL DISCUSSION Castaneda-Gutier
- Page 270 and 271:
GENERAL DISCUSSION encapsulated (LE
- Page 272 and 273:
GENERAL DISCUSSION Friggens, N. C.,
- Page 274 and 275:
GENERAL DISCUSSION linoleic acid on
- Page 276 and 277:
GENERAL DISCUSSION Lucy, M. C., C.
- Page 278 and 279:
GENERAL DISCUSSION Nikkhah, A., J.
- Page 280 and 281:
GENERAL DISCUSSION Rajala, P. J. an
- Page 282 and 283:
GENERAL DISCUSSION Stengarde, L., K
- Page 284:
GENERAL DISCUSSION Wathes, D. C., D
- Page 290 and 291:
SUMMARY The time span during which
- Page 292 and 293:
SUMMARY correlation with PC2 was po
- Page 294 and 295:
SUMMARY reflected in CE and PL but
- Page 298:
SAMENVATTING
- Page 301 and 302:
SAMENVATTING Management Facilitiy).
- Page 303 and 304:
SAMENVATTING totale opbrengst als h
- Page 305:
SAMENVATTING van het OVZ-gehalte va
- Page 310:
CURRICULUM VITAE Miel Hostens werd
- Page 314 and 315:
BIBLIOGRAPHY INTERNATIONAL PAPERS D
- Page 316 and 317:
BIBLIOGRAPHY NATIONAL PAPERS Cools,
- Page 318 and 319:
BIBLIOGRAPHY Hostens, M., L. Peelma
- Page 320:
BIBLIOGRAPHY in early lactating dai
- Page 326 and 327:
DANKWOORD Misschien is het niet zo
- Page 328 and 329:
DANKWOORD Alle collega’s van de b
- Page 330 and 331:
DANKWOORD De medewerkers van Unifor
- Page 332 and 333:
DANKWOORD Via een intense samenwerk
- Page 334 and 335:
DANKWOORD doe. Ook al komt er af en