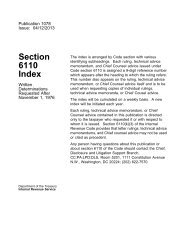
170 REPORT OF COMMISSIONER OF INTERNAL REVENUE REPORT OF COMMISSIONER OF INTERNAL REVENUE 171 TABLE 51.-Withdrawals: Specially denatured alcohol, by leading' formulas and by months, fiscal year <strong>1949</strong> [Wine gallons] TABLE 52.-Summary: Ethyl alcohol used for denaturation, and production, withdrawals, stocks on hand June 30, and losses of denatured alcohol, and denaturing plants operated, by States, fiscal year <strong>1949</strong> .5 DI 0 4-Al it ma si zg .sthhAaA ko =.4.00,4 Formula July August September October November December 6,152,170 1,814,120 1,489,874 558,024 257,693 295,417 6,330 147,904 210, 158 81,933 79, 526 104,403 43,230 1,026 27,339 27,067 33,647 22,417 11,674 7,781 36,317 6,286,502 1,726,338 1,707,923 436,812 271, 734 311, 547 62,866 199,776 221,834 119,520 71, 592 110,407 66,212 38,941 35,139 27,145 12,528 27,748 17,118 29,235 7,080, 685 1,806,947 1,889,312 534,511 366,180 333,611 63,532 207,990 226,864 118,011 80, 259 115,511 68,823 26, 237 42,004 57,689 36,465 12,092 9,532 34,639 6, 987, 610 1,901,679 1,806,887 432,752 358,643 310,012 69,782 245,749 161,340 152,888 111, 764 97,840 61,322 24,205 50,317 51,906 46,263 28,948 24,145 11, 503 37,530 9,678,790 1,954,471 1,627,470 303,692 292,442 315,406 67,283 159,047 195,478 151,947 112 867 86,918 72,299 24,159 59,634 33,346 53,579 23,333 26,676 6,833 W, 764 9,387,388 1,986,448 1,541,168 500,627 309,650 216,759 126,905 158,406 156,218 107,575 111, 374 103,061 54,916 81,749 54,459 56,524 84,445 13,340 21,336 6,601 35,287 11, 388,050 11,770,917 13,110,794 12,973,085 15,274,384 15,063,238 Formula January February March April May June Total m co 0 p;
172 REPORT OF COMMISSIONER OF INTERNAL REVENUE TABLE 53.-Operations in specially denatured alcohol: By bonded dealers, by States, fiscal year <strong>1949</strong> [Wine gallons] State Received 1 Removed 1 _ Losses s° Tune 30 California 3 -1, 986 48 Connecticut 76, 315 71, 782 7,109 Illinois 113, 315 119, 979 688 22, 356 Kentucky 28, 519 29, 661 2, 283 Maryland 31, 227 30, 387 15 4, 194 Massachusetts 99,002 95,092 2 11,267 Michigan 57,167 58, 579 5 4, 756 Minnesota 53, 681 55, 013 10 5,363 Missouri 169,185 168, 595 48 14, 056 New Jersey 17, 418, 897 1 7, 442, 846 1,805 48, 297 New York 5, 005 5,599 216 Ohio 217, 352 215, 208 132 17, 580 Texas 10, 514, 525 9, 786, 824 23, 834 736, 570 Utah 4, 522 4,155 2 1,168 Washington 1,569 1,427 1,765 Wisconsin 62 Number of dealers operating 2 Total- 28,783, 315 28, 084, 704 26,541 877,028 37 1 Excludes interdealer shipments. 2 Represents number operating during any part of the year. 3 Represents an excess of returns over receipts. TABLE 54.-Operations in specially denatured alcohol: By manufacturers, by States' fiscal year <strong>1949</strong> [Wine gallons] titiNtiNbNNb bNWNtititi REPORT OF COMMISSIONER OF INTERNAL REVENUE 173 TABLE 54.-Operations in specially denatured alcohol: By manufacturers, by States, fiscal year <strong>1949</strong>-Continued Oklahoma Oregon Pennsylvania Puerto Rico Rhode Island South Carolina South Dakota Tennessee Texas. Utah Vermont Virginia Washington West Virginia Wisconsin Wyoming Total [Wine gallons] State Received Recovered after user 37, 597 154,318 12, 322, 776 502, 926 22,575 1,567 39 22, 451, 019 12, 831, 978 4,138 499 689,257 3,100 44,173, 860 560, 457 30 16, 005,188 130 17, 297 1,88%023 30, 592,181 7, 919 Used In manufacturtzi °nein g recovered alcohol) 36, 533 162,186 26, KO, 542 501, 709 20 884 1 , , 529 84 22, 464, 705 12, 454, 936 4, 361 982 2, 387,139 3,404 71, 788,828 534,174 42 Losses 1 1, 802 5 3, 711 11,466 3 17 8 24 127 stocks June 30 7,623 11, 684 1, 659, 235 2,182 3, 460 357 9 3, 30% 923 561,316 240 36 76, 537 397 4,562, 704 54, 091 12 Number of 17128.1211- lecturers or:4 2 154, 299,797 117, 893,693 266, 179, 133 83,940 13, 979,713 4,153 lIn some industries where the denatured alcohol does not become a part of the product, a portion Is recovered and reused. Represents number operating during any part of the year. s Includes 165,523 wine gallons recovered from solutions received containing specially denatured alcohol. ZXV.MR`I' PrI• S Z Fi R"' State Received Reeovered after use 1 Used in manufactilting (including recovered alcohol) Losses Maw Stocks June 30 Number of menufacturers °matkg 2 Alabama 73, 497 6, 372 79,101 10 7, 759 Arizona_ 149 130 22 Arkansas 296, 909 288, 1/89 21, 297 California. 2, 758, 838 1,184, 758 3, 944, 725 2,155 25%540 Colorado 32,699 39, 235 2 14, 868 Connecticut 820, 735 765, 571 779 93,099 Delaware 105,623 861,594 947,146 23 32,767 District of Columbia 57, 293 53, 785 9 5, 335 Florida 47, 099 49, 728 99, 089 11. 9, 286 Georgia 183,403 170,995 8 16,900 Hawaii 6,475 6,520 199 Idaho 70 71 12 Illinois 4,975,143 1,798,332 6, 689 419 5,104 353,569 Indiana 4, 506,196 8, 781, 359 13, 141, 062 1,411 299, 036 Iowa 153, 603 139, 562 41 10, 905 Kansas 59,471 59,334 4,615 Kentucky 128, 210 128,694 8,787 Louisiana. 4, 960, 702 12,869, 741 17, 876, 412 17 41,901 Maine 47, 868 97, 859 80 Maryland 3,154, 271 280, 679 3, 349, 867 300 158, 280 Massachusetts 3, 362, 528 3, 428, 286 6, 706, 921 13, 606 193,746 Michigan 2, 267, 526 1,005, 879 3,140, 720 3,487 238,405 Minnesota_ 18%985 191, 874 29 20,155 Mississippi 185, 921 8, 009,158 8,172, 722 32, 582 Missouri 2,378, 687 3,699, 707 5, 994, 832 2, 297 242,191 Montana 25 25 8 Nebraska 2,344 5 2,160 3 481 Nevada 449, 073 422, 322 31, 251 New Hampshire 16,106 16,138 129 New Jersey 20, 978, 094 19, 609,263 40, 352,183 30, 310 1, 037, 065 New Mexico 388 375 49 New York 1 6, 978,255 7,321, 835 14, 248, 568 3, 755 44%672 North Carolina 595,151 595,880 6 37,338 North Dakota 43 35 13 Ohio 781.291 476.263 1.261.186 3,413 135,601 See footnotes at end of table. gc 1,21Mg4r"UpRW.'=J M NgMrr g-p- A


![l..l.l.L. 4DB.DI3-l]t] xxxxxxxxxxxxxxxx - Internal Revenue Service](https://img.yumpu.com/51302394/1/190x245/llll-4dbdi3-lt-xxxxxxxxxxxxxxxx-internal-revenue-service.jpg?quality=85)