- Page 1:
Saldanha Bay and Langebaan Lagoon:
- Page 5 and 6:
State of Saldanha Bay & Langebaan L
- Page 7 and 8:
State of Saldanha Bay & Langebaan L
- Page 9 and 10:
State of Saldanha Bay & Langebaan L
- Page 11 and 12:
State of Saldanha Bay & Langebaan L
- Page 13 and 14:
State of Saldanha Bay & Langebaan L
- Page 15 and 16:
State of Saldanha Bay & Langebaan L
- Page 17 and 18:
State of Saldanha Bay & Langebaan L
- Page 19 and 20:
State of Saldanha Bay & Langebaan L
- Page 21 and 22:
State of Saldanha Bay & Langebaan L
- Page 23 and 24:
State of Saldanha Bay & Langebaan L
- Page 25 and 26:
State of Saldanha Bay & Langebaan L
- Page 27 and 28:
State of Saldanha Bay & Langebaan L
- Page 29 and 30:
State of Saldanha Bay & Langebaan L
- Page 31 and 32:
State of Saldanha Bay & Langebaan L
- Page 33 and 34:
State of Saldanha Bay & Langebaan L
- Page 35 and 36:
State of Saldanha Bay & Langebaan L
- Page 37 and 38:
State of Saldanha Bay & Langebaan L
- Page 39 and 40:
State of Saldanha Bay & Langebaan L
- Page 41 and 42:
State of Saldanha Bay & Langebaan L
- Page 43 and 44:
State of Saldanha Bay & Langebaan L
- Page 45 and 46:
State of Saldanha Bay & Langebaan L
- Page 47 and 48:
State of Saldanha Bay & Langebaan L
- Page 49 and 50:
Jul-05 Sep-05 Nov-05 Jan-06 Mar-06
- Page 51 and 52:
State of Saldanha Bay & Langebaan L
- Page 53 and 54:
State of Saldanha Bay & Langebaan L
- Page 55 and 56:
State of Saldanha Bay & Langebaan L
- Page 57 and 58:
State of Saldanha Bay & Langebaan L
- Page 59 and 60:
State of Saldanha Bay & Langebaan L
- Page 61 and 62:
State of Saldanha Bay & Langebaan L
- Page 63 and 64:
State of Saldanha Bay & Langebaan L
- Page 65 and 66:
State of Saldanha Bay & Langebaan L
- Page 67 and 68:
State of Saldanha Bay & Langebaan L
- Page 69 and 70:
State of Saldanha Bay & Langebaan L
- Page 71 and 72:
Average Daily Flow (m3/day) Apr-03
- Page 73 and 74:
State of Saldanha Bay & Langebaan L
- Page 75 and 76:
Average daily flow (m 3 /day) Faeca
- Page 77 and 78:
Ammonia Nitrogen (mg/l as N) Nitrat
- Page 79 and 80:
State of Saldanha Bay & Langebaan L
- Page 81 and 82:
State of Saldanha Bay & Langebaan L
- Page 83 and 84:
State of Saldanha Bay & Langebaan L
- Page 85 and 86:
Volume of Effluent (kL) Jan-01 Mar-
- Page 87 and 88:
Mussels Oysters Abalone Scallops Re
- Page 89 and 90:
State of Saldanha Bay & Langebaan L
- Page 91 and 92:
State of Saldanha Bay & Langebaan L
- Page 93 and 94:
State of Saldanha Bay & Langebaan L
- Page 95 and 96:
State of Saldanha Bay & Langebaan L
- Page 97 and 98:
State of Saldanha Bay & Langebaan L
- Page 99 and 100:
State of Saldanha Bay & Langebaan L
- Page 101 and 102:
State of Saldanha Bay & Langebaan L
- Page 103 and 104:
State of Saldanha Bay & Langebaan L
- Page 105 and 106:
State of Saldanha Bay & Langebaan L
- Page 107 and 108:
State of Saldanha Bay & Langebaan L
- Page 109 and 110:
State of Saldanha Bay & Langebaan L
- Page 111 and 112:
Cadmium (mg/kg) Lead(mg/kg) Mercury
- Page 113 and 114:
State of Saldanha Bay & Langebaan L
- Page 115 and 116:
State of Saldanha Bay & Langebaan L
- Page 117 and 118:
Beach Width (m) State of Saldanha B
- Page 119 and 120:
State of Saldanha Bay & Langebaan L
- Page 121 and 122:
State of Saldanha Bay & Langebaan L
- Page 123 and 124:
State of Saldanha Bay & Langebaan L
- Page 125 and 126:
State of Saldanha Bay & Langebaan L
- Page 127 and 128:
State of Saldanha Bay & Langebaan L
- Page 129 and 130:
State of Saldanha Bay & Langebaan L
- Page 131 and 132:
State of Saldanha Bay & Langebaan L
- Page 133 and 134:
State of Saldanha Bay & Langebaan L
- Page 135 and 136:
State of Saldanha Bay & Langebaan L
- Page 137 and 138:
State of Saldanha Bay & Langebaan L
- Page 139 and 140:
State of Saldanha Bay & Langebaan L
- Page 141 and 142:
State of Saldanha Bay & Langebaan L
- Page 143 and 144:
State of Saldanha Bay & Langebaan L
- Page 145 and 146:
Copper (mg/kg) Copper (mg/kg) Coppe
- Page 147 and 148:
State of Saldanha Bay & Langebaan L
- Page 149 and 150:
State of Saldanha Bay & Langebaan L
- Page 151 and 152:
State of Saldanha Bay & Langebaan L
- Page 153 and 154:
State of Saldanha Bay & Langebaan L
- Page 155 and 156:
State of Saldanha Bay & Langebaan L
- Page 157 and 158:
State of Saldanha Bay & Langebaan L
- Page 159 and 160:
No. saltmarsh patches Saltmarsh are
- Page 161 and 162:
State of Saldanha Bay & Langebaan L
- Page 163 and 164:
State of Saldanha Bay & Langebaan L
- Page 165 and 166:
State of Saldanha Bay & Langebaan L
- Page 167 and 168: State of Saldanha Bay & Langebaan L
- Page 169 and 170: State of Saldanha Bay & Langebaan L
- Page 171 and 172: Top 10 species contributing to simi
- Page 173 and 174: State of Saldanha Bay & Langebaan L
- Page 175 and 176: State of Saldanha Bay & Langebaan L
- Page 177 and 178: Proportion of total number of indiv
- Page 179 and 180: State of Saldanha Bay & Langebaan L
- Page 181 and 182: State of Saldanha Bay & Langebaan L
- Page 183 and 184: State of Saldanha Bay & Langebaan L
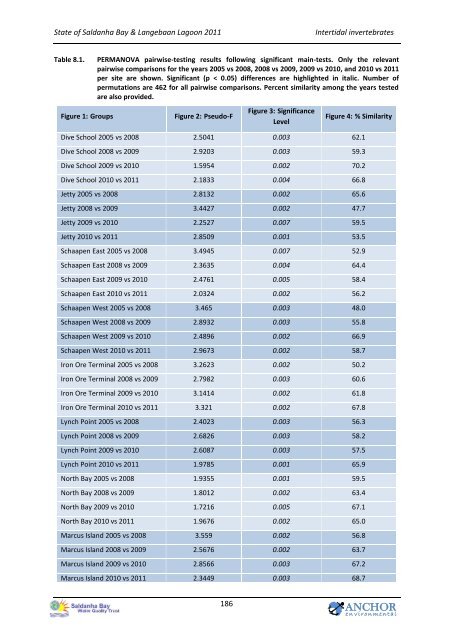
- Page 185 and 186: State of Saldanha Bay & Langebaan L
- Page 187 and 188: State of Saldanha Bay & Langebaan L
- Page 189 and 190: State of Saldanha Bay & Langebaan L
- Page 191 and 192: State of Saldanha Bay & Langebaan L
- Page 193 and 194: State of Saldanha Bay & Langebaan L
- Page 195 and 196: State of Saldanha Bay & Langebaan L
- Page 197 and 198: State of Saldanha Bay & Langebaan L
- Page 199 and 200: State of Saldanha Bay & Langebaan L
- Page 201 and 202: State of Saldanha Bay & Langebaan L
- Page 203 and 204: State of Saldanha Bay & Langebaan L
- Page 205 and 206: State of Saldanha Bay & Langebaan L
- Page 207 and 208: State of Saldanha Bay & Langebaan L
- Page 209 and 210: Afrolittorina knysnaensis (no/0.5 m
- Page 211 and 212: Similarity Iron Ore Jetty Iron Ore
- Page 213 and 214: State of Saldanha Bay & Langebaan L
- Page 215 and 216: Lynch Point State of Saldanha Bay &
- Page 217: Dive School Jetty Schaapen East Sch
- Page 221 and 222: High 05 High 08 High 09 High 10 Hig
- Page 223 and 224: State of Saldanha Bay & Langebaan L
- Page 225 and 226: State of Saldanha Bay & Langebaan L
- Page 227 and 228: State of Saldanha Bay & Langebaan L
- Page 229 and 230: Number of species State of Saldanha
- Page 231 and 232: State of Saldanha Bay & Langebaan L
- Page 233 and 234: State of Saldanha Bay & Langebaan L
- Page 235 and 236: Fish abundance (No.m -2 ) State of
- Page 237 and 238: State of Saldanha Bay & Langebaan L
- Page 239 and 240: State of Saldanha Bay & Langebaan L
- Page 241 and 242: State of Saldanha Bay & Langebaan L
- Page 243 and 244: State of Saldanha Bay & Langebaan L
- Page 245 and 246: State of Saldanha Bay & Langebaan L
- Page 247 and 248: State of Saldanha Bay & Langebaan L
- Page 249 and 250: State of Saldanha Bay & Langebaan L
- Page 251 and 252: State of Saldanha Bay & Langebaan L
- Page 253 and 254: Number of breeding pairs State of S
- Page 255 and 256: Number of breeding pairs State of S
- Page 257 and 258: Number of breeding pairs State of S
- Page 259 and 260: State of Saldanha Bay & Langebaan L
- Page 261 and 262: Number of breeding pairs State of S
- Page 263 and 264: State of Saldanha Bay & Langebaan L
- Page 265 and 266: Number of birds 1976 1977 1978 1979
- Page 267 and 268: State of Saldanha Bay & Langebaan L
- Page 269 and 270:
State of Saldanha Bay & Langebaan L
- Page 271 and 272:
State of Saldanha Bay & Langebaan L
- Page 273 and 274:
State of Saldanha Bay & Langebaan L
- Page 275 and 276:
No. sites Abundance (no. ind. m -2
- Page 277 and 278:
State of Saldanha Bay & Langebaan L
- Page 279 and 280:
State of Saldanha Bay & Langebaan L
- Page 281 and 282:
State of Saldanha Bay & Langebaan L
- Page 283 and 284:
State of Saldanha Bay & Langebaan L
- Page 285 and 286:
State of Saldanha Bay & Langebaan L
- Page 287 and 288:
State of Saldanha Bay & Langebaan L
- Page 289 and 290:
State of Saldanha Bay & Langebaan L
- Page 291 and 292:
State of Saldanha Bay & Langebaan L
- Page 293 and 294:
State of Saldanha Bay & Langebaan L
- Page 295 and 296:
State of Saldanha Bay & Langebaan L
- Page 297 and 298:
State of Saldanha Bay & Langebaan L
- Page 299 and 300:
State of Saldanha Bay & Langebaan L
- Page 301 and 302:
State of Saldanha Bay & Langebaan L
- Page 303:
State of Saldanha Bay & Langebaan L


