State of the Bay Report 2011-Final.pdf - Anchor Environmental
State of the Bay Report 2011-Final.pdf - Anchor Environmental
State of the Bay Report 2011-Final.pdf - Anchor Environmental
You also want an ePaper? Increase the reach of your titles
YUMPU automatically turns print PDFs into web optimized ePapers that Google loves.
<strong>State</strong> <strong>of</strong> Saldanha <strong>Bay</strong> & Langebaan Lagoon <strong>2011</strong><br />
List <strong>of</strong> Tables<br />
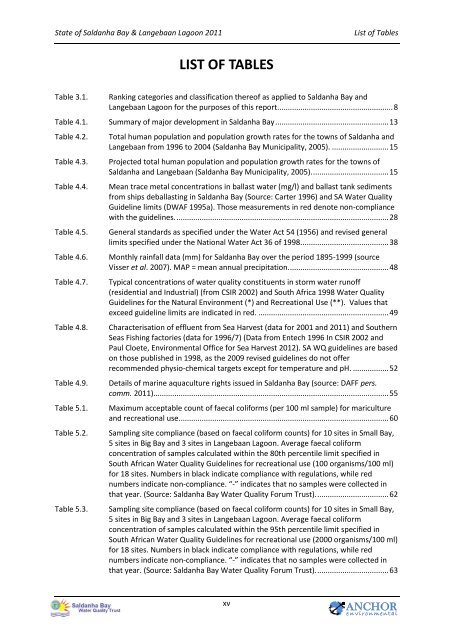
LIST OF TABLES<br />
Table 3.1.<br />
Ranking categories and classification <strong>the</strong>re<strong>of</strong> as applied to Saldanha <strong>Bay</strong> and<br />
Langebaan Lagoon for <strong>the</strong> purposes <strong>of</strong> this report. ...................................................... 8<br />
Table 4.1. Summary <strong>of</strong> major development in Saldanha <strong>Bay</strong> ...................................................... 13<br />
Table 4.2.<br />
Table 4.3.<br />
Table 4.4.<br />
Table 4.5.<br />
Table 4.6.<br />
Table 4.7.<br />
Table 4.8.<br />
Table 4.9.<br />
Table 5.1.<br />
Table 5.2.<br />
Table 5.3.<br />
Total human population and population growth rates for <strong>the</strong> towns <strong>of</strong> Saldanha and<br />
Langebaan from 1996 to 2004 (Saldanha <strong>Bay</strong> Municipality, 2005). ........................... 15<br />
Projected total human population and population growth rates for <strong>the</strong> towns <strong>of</strong><br />
Saldanha and Langebaan (Saldanha <strong>Bay</strong> Municipality, 2005). .................................... 15<br />
Mean trace metal concentrations in ballast water (mg/l) and ballast tank sediments<br />
from ships deballasting in Saldanha <strong>Bay</strong> (Source: Carter 1996) and SA Water Quality<br />
Guideline limits (DWAF 1995a). Those measurements in red denote non-compliance<br />
with <strong>the</strong> guidelines. ..................................................................................................... 28<br />
General standards as specified under <strong>the</strong> Water Act 54 (1956) and revised general<br />
limits specified under <strong>the</strong> National Water Act 36 <strong>of</strong> 1998. ......................................... 38<br />
Monthly rainfall data (mm) for Saldanha <strong>Bay</strong> over <strong>the</strong> period 1895-1999 (source<br />
Visser et al. 2007). MAP = mean annual precipitation. ............................................... 48<br />
Typical concentrations <strong>of</strong> water quality constituents in storm water run<strong>of</strong>f<br />
(residential and Industrial) (from CSIR 2002) and South Africa 1998 Water Quality<br />
Guidelines for <strong>the</strong> Natural Environment (*) and Recreational Use (**). Values that<br />
exceed guideline limits are indicated in red. .............................................................. 49<br />
Characterisation <strong>of</strong> effluent from Sea Harvest (data for 2001 and <strong>2011</strong>) and Sou<strong>the</strong>rn<br />
Seas Fishing factories (data for 1996/7) (Data from Entech 1996 In CSIR 2002 and<br />
Paul Cloete, <strong>Environmental</strong> Office for Sea Harvest 2012). SA WQ guidelines are based<br />
on those published in 1998, as <strong>the</strong> 2009 revised guidelines do not <strong>of</strong>fer<br />
recommended physio-chemical targets except for temperature and pH. ................. 52<br />
Details <strong>of</strong> marine aquaculture rights issued in Saldanha <strong>Bay</strong> (source: DAFF pers.<br />
comm. <strong>2011</strong>)................................................................................................................ 55<br />
Maximum acceptable count <strong>of</strong> faecal coliforms (per 100 ml sample) for mariculture<br />
and recreational use .................................................................................................... 60<br />
Sampling site compliance (based on faecal coliform counts) for 10 sites in Small <strong>Bay</strong>,<br />
5 sites in Big <strong>Bay</strong> and 3 sites in Langebaan Lagoon. Average faecal coliform<br />
concentration <strong>of</strong> samples calculated within <strong>the</strong> 80th percentile limit specified in<br />
South African Water Quality Guidelines for recreational use (100 organisms/100 ml)<br />
for 18 sites. Numbers in black indicate compliance with regulations, while red<br />
numbers indicate non-compliance. “-” indicates that no samples were collected in<br />
that year. (Source: Saldanha <strong>Bay</strong> Water Quality Forum Trust). .................................. 62<br />
Sampling site compliance (based on faecal coliform counts) for 10 sites in Small <strong>Bay</strong>,<br />
5 sites in Big <strong>Bay</strong> and 3 sites in Langebaan Lagoon. Average faecal coliform<br />
concentration <strong>of</strong> samples calculated within <strong>the</strong> 95th percentile limit specified in<br />
South African Water Quality Guidelines for recreational use (2000 organisms/100 ml)<br />
for 18 sites. Numbers in black indicate compliance with regulations, while red<br />
numbers indicate non-compliance. “-” indicates that no samples were collected in<br />
that year. (Source: Saldanha <strong>Bay</strong> Water Quality Forum Trust). .................................. 63<br />
xv<br />
ANCHOR<br />
e n v i r o n m en t a l


