

State of the Bay Report 2011-Final.pdf - Anchor Environmental
State of the Bay Report 2011-Final.pdf - Anchor Environmental
State of the Bay Report 2011-Final.pdf - Anchor Environmental

You also want an ePaper? Increase the reach of your titles
YUMPU automatically turns print PDFs into web optimized ePapers that Google loves.
<strong>State</strong> <strong>of</strong> Saldanha <strong>Bay</strong> & Langebaan Lagoon <strong>2011</strong><br />
Intertidal invertebrates<br />
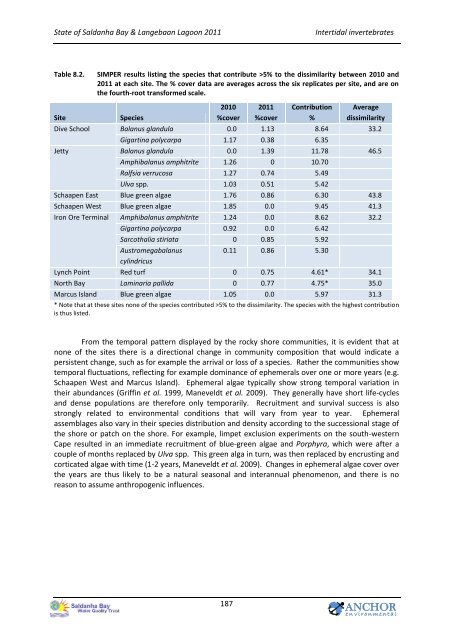
Table 8.2.<br />
Site<br />
SIMPER results listing <strong>the</strong> species that contribute >5% to <strong>the</strong> dissimilarity between 2010 and<br />
<strong>2011</strong> at each site. The % cover data are averages across <strong>the</strong> six replicates per site, and are on<br />
<strong>the</strong> fourth-root transformed scale.<br />
Species<br />
2010<br />
%cover<br />
<strong>2011</strong><br />
%cover<br />
Contribution<br />
%<br />
Average<br />
dissimilarity<br />
Dive School Balanus glandula 0.0 1.13 8.64 33.2<br />
Gigartina polycarpa 1.17 0.38 6.35<br />
Jetty Balanus glandula 0.0 1.39 11.78 46.5<br />
Amphibalanus amphitrite 1.26 0 10.70<br />
Ralfsia verrucosa 1.27 0.74 5.49<br />
Ulva spp. 1.03 0.51 5.42<br />
Schaapen East Blue green algae 1.76 0.86 6.30 43.8<br />
Schaapen West Blue green algae 1.85 0.0 9.45 41.3<br />
Iron Ore Terminal Amphibalanus amphitrite 1.24 0.0 8.62 32.2<br />
Gigartina polycarpa 0.92 0.0 6.42<br />
Sarcothalia stiriata 0 0.85 5.92<br />
Austromegabalanus<br />
cylindricus<br />
0.11 0.86 5.30<br />
Lynch Point Red turf 0 0.75 4.61* 34.1<br />
North <strong>Bay</strong> Laminaria pallida 0 0.77 4.75* 35.0<br />
Marcus Island Blue green algae 1.05 0.0 5.97 31.3<br />
* Note that at <strong>the</strong>se sites none <strong>of</strong> <strong>the</strong> species contributed >5% to <strong>the</strong> dissimilarity. The species with <strong>the</strong> highest contribution<br />
is thus listed.<br />
From <strong>the</strong> temporal pattern displayed by <strong>the</strong> rocky shore communities, it is evident that at<br />
none <strong>of</strong> <strong>the</strong> sites <strong>the</strong>re is a directional change in community composition that would indicate a<br />
persistent change, such as for example <strong>the</strong> arrival or loss <strong>of</strong> a species. Ra<strong>the</strong>r <strong>the</strong> communities show<br />
temporal fluctuations, reflecting for example dominance <strong>of</strong> ephemerals over one or more years (e.g.<br />
Schaapen West and Marcus Island). Ephemeral algae typically show strong temporal variation in<br />
<strong>the</strong>ir abundances (Griffin et al. 1999, Maneveldt et al. 2009). They generally have short life-cycles<br />
and dense populations are <strong>the</strong>refore only temporarily. Recruitment and survival success is also<br />
strongly related to environmental conditions that will vary from year to year. Ephemeral<br />
assemblages also vary in <strong>the</strong>ir species distribution and density according to <strong>the</strong> successional stage <strong>of</strong><br />
<strong>the</strong> shore or patch on <strong>the</strong> shore. For example, limpet exclusion experiments on <strong>the</strong> south-western<br />
Cape resulted in an immediate recruitment <strong>of</strong> blue-green algae and Porphyra, which were after a<br />
couple <strong>of</strong> months replaced by Ulva spp. This green alga in turn, was <strong>the</strong>n replaced by encrusting and<br />
corticated algae with time (1-2 years, Maneveldt et al. 2009). Changes in ephemeral algae cover over<br />
<strong>the</strong> years are thus likely to be a natural seasonal and interannual phenomenon, and <strong>the</strong>re is no<br />
reason to assume anthropogenic influences.<br />
187<br />
ANCHOR<br />
e n v i r o n m en t a l


