

State of the Bay Report 2011-Final.pdf - Anchor Environmental
State of the Bay Report 2011-Final.pdf - Anchor Environmental
State of the Bay Report 2011-Final.pdf - Anchor Environmental

You also want an ePaper? Increase the reach of your titles
YUMPU automatically turns print PDFs into web optimized ePapers that Google loves.
<strong>State</strong> <strong>of</strong> Saldanha <strong>Bay</strong> & Langebaan Lagoon <strong>2011</strong><br />
Activities & discharges<br />
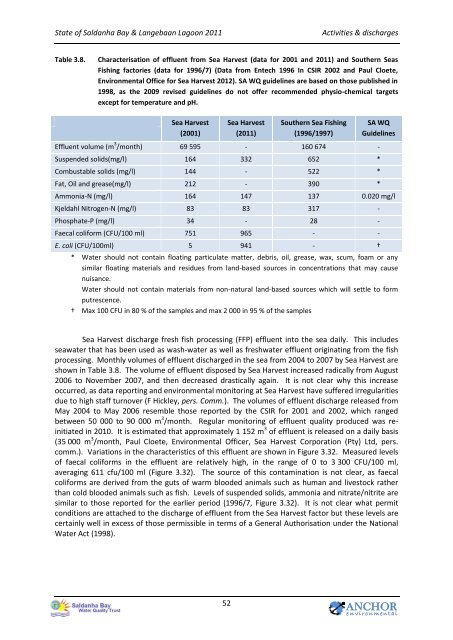
Table 3.8.<br />
Characterisation <strong>of</strong> effluent from Sea Harvest (data for 2001 and <strong>2011</strong>) and Sou<strong>the</strong>rn Seas<br />
Fishing factories (data for 1996/7) (Data from Entech 1996 In CSIR 2002 and Paul Cloete,<br />
<strong>Environmental</strong> Office for Sea Harvest 2012). SA WQ guidelines are based on those published in<br />
1998, as <strong>the</strong> 2009 revised guidelines do not <strong>of</strong>fer recommended physio-chemical targets<br />
except for temperature and pH.<br />
Sea Harvest<br />
(2001)<br />
Sea Harvest<br />
(<strong>2011</strong>)<br />
Sou<strong>the</strong>rn Sea Fishing<br />
(1996/1997)<br />
SA WQ<br />
Guidelines<br />
Effluent volume (m 3 /month) 69 595 - 160 674 -<br />
Suspended solids(mg/l) 164 332 652 *<br />
Combustable solids (mg/l) 144 - 522 *<br />
Fat, Oil and grease(mg/l) 212 - 390 *<br />
Ammonia-N (mg/l) 164 147 137 0.020 mg/l<br />
Kjeldahl Nitrogen-N (mg/l) 83 83 317 -<br />
Phosphate-P (mg/l) 34 - 28 -<br />
Faecal coliform (CFU/100 ml) 751 965 - -<br />
E. coli (CFU/100ml) 5 941 - †<br />
* Water should not contain floating particulate matter, debris, oil, grease, wax, scum, foam or any<br />
similar floating materials and residues from land-based sources in concentrations that may cause<br />
nuisance.<br />
Water should not contain materials from non-natural land-based sources which will settle to form<br />
putrescence.<br />
† Max 100 CFU in 80 % <strong>of</strong> <strong>the</strong> samples and max 2 000 in 95 % <strong>of</strong> <strong>the</strong> samples<br />
Sea Harvest discharge fresh fish processing (FFP) effluent into <strong>the</strong> sea daily. This includes<br />
seawater that has been used as wash-water as well as freshwater effluent originating from <strong>the</strong> fish<br />
processing. Monthly volumes <strong>of</strong> effluent discharged in <strong>the</strong> sea from 2004 to 2007 by Sea Harvest are<br />
shown in Table 3.8. The volume <strong>of</strong> effluent disposed by Sea Harvest increased radically from August<br />
2006 to November 2007, and <strong>the</strong>n decreased drastically again. It is not clear why this increase<br />
occurred, as data reporting and environmental monitoring at Sea Harvest have suffered irregularities<br />
due to high staff turnover (F Hickley, pers. Comm.). The volumes <strong>of</strong> effluent discharge released from<br />
May 2004 to May 2006 resemble those reported by <strong>the</strong> CSIR for 2001 and 2002, which ranged<br />
between 50 000 to 90 000 m 3 /month. Regular monitoring <strong>of</strong> effluent quality produced was reinitiated<br />
in 2010. It is estimated that approximately 1 152 m 3 <strong>of</strong> effluent is released on a daily basis<br />
(35 000 m 3 /month, Paul Cloete, <strong>Environmental</strong> Officer, Sea Harvest Corporation (Pty) Ltd, pers.<br />
comm.). Variations in <strong>the</strong> characteristics <strong>of</strong> this effluent are shown in Figure 3.32. Measured levels<br />
<strong>of</strong> faecal coliforms in <strong>the</strong> effluent are relatively high, in <strong>the</strong> range <strong>of</strong> 0 to 3 300 CFU/100 ml,<br />
averaging 611 cfu/100 ml (Figure 3.32). The source <strong>of</strong> this contamination is not clear, as faecal<br />
coliforms are derived from <strong>the</strong> guts <strong>of</strong> warm blooded animals such as human and livestock ra<strong>the</strong>r<br />
than cold blooded animals such as fish. Levels <strong>of</strong> suspended solids, ammonia and nitrate/nitrite are<br />
similar to those reported for <strong>the</strong> earlier period (1996/7, Figure 3.32). It is not clear what permit<br />
conditions are attached to <strong>the</strong> discharge <strong>of</strong> effluent from <strong>the</strong> Sea Harvest factor but <strong>the</strong>se levels are<br />
certainly well in excess <strong>of</strong> those permissible in terms <strong>of</strong> a General Authorisation under <strong>the</strong> National<br />
Water Act (1998).<br />
52<br />
ANCHOR<br />
e n v i r o n m en t a l


