

State of the Bay Report 2011-Final.pdf - Anchor Environmental
State of the Bay Report 2011-Final.pdf - Anchor Environmental
State of the Bay Report 2011-Final.pdf - Anchor Environmental

You also want an ePaper? Increase the reach of your titles
YUMPU automatically turns print PDFs into web optimized ePapers that Google loves.
<strong>State</strong> <strong>of</strong> Saldanha <strong>Bay</strong> & Langebaan Lagoon <strong>2011</strong><br />
Fish<br />
9.3.4 Multivariate analysis <strong>of</strong> spatial and temporal trends in fish communities<br />
The use <strong>of</strong> multivariate statistical techniques allows for <strong>the</strong> analysis <strong>of</strong> any patterns in <strong>the</strong> complete<br />
fish community, taking account <strong>of</strong> both <strong>the</strong> community species composition, and <strong>the</strong> abundance <strong>of</strong><br />
each species. In <strong>the</strong> 2009 <strong>State</strong> <strong>of</strong> <strong>the</strong> <strong>Bay</strong> report, multivariate analyses showed that on average, <strong>the</strong><br />
fish communities from each <strong>of</strong> <strong>the</strong> three areas (Small <strong>Bay</strong>, Big <strong>Bay</strong> and Langebaan Lagoon) are<br />
significantly different from each o<strong>the</strong>r. This was related to environmental differences between <strong>the</strong><br />
three areas. It was concluded that although <strong>the</strong> whole Saldanha <strong>Bay</strong>- Langebaan Lagoon system is<br />
connected, <strong>the</strong> near-shore environment in one area (i.e. Small <strong>Bay</strong>, Big <strong>Bay</strong> or <strong>the</strong> Lagoon) on<br />
average, appears more suitable to <strong>the</strong> juveniles <strong>of</strong> particular species than <strong>the</strong> o<strong>the</strong>r areas.<br />
The statistically significant differences in <strong>the</strong> fish communities found in <strong>the</strong> three main areas<br />
(Small <strong>Bay</strong>, Big <strong>Bay</strong> and Langebaan Lagoon), as well as <strong>the</strong> similarities between sites within each <strong>of</strong><br />
<strong>the</strong>se areas, supported <strong>the</strong> analysis <strong>of</strong> temporal trends (which provide information on changes in <strong>the</strong><br />
health <strong>of</strong> <strong>the</strong> marine environment) on an area specific basis. The 2010 <strong>State</strong> <strong>of</strong> <strong>the</strong> <strong>Bay</strong> report also<br />
reported on <strong>the</strong> separation <strong>of</strong> <strong>the</strong> different sites within each area, based on dissimilarities in <strong>the</strong> fish<br />
community between sites. This separation is similar to <strong>the</strong> overall trend in fish communities<br />
throughout <strong>the</strong> bay and lagoon, a pattern relating to <strong>the</strong> degree <strong>of</strong> exposure <strong>of</strong> each site was<br />
evident, from <strong>the</strong> most exposed sites through to <strong>the</strong> most sheltered samples. In this report, analysis<br />
focussed on detecting any differences between years, taking account <strong>of</strong> <strong>the</strong> established inter-site<br />
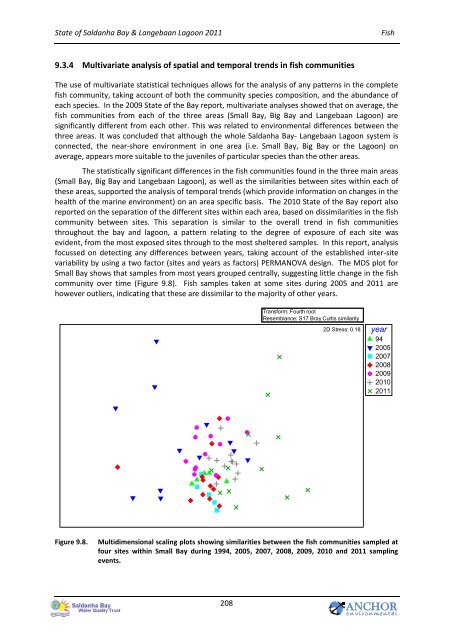
variability by using a two factor (sites and years as factors) PERMANOVA design. The MDS plot for<br />
Small <strong>Bay</strong> shows that samples from most years grouped centrally, suggesting little change in <strong>the</strong> fish<br />
community over time (Figure 9.8). Fish samples taken at some sites during 2005 and <strong>2011</strong> are<br />
however outliers, indicating that <strong>the</strong>se are dissimilar to <strong>the</strong> majority <strong>of</strong> o<strong>the</strong>r years.<br />
Transform: Fourth root<br />
Resemblance: S17 Bray Curtis similarity<br />
2D Stress: 0.18<br />
year<br />
94<br />
2005<br />
2007<br />
2008<br />
2009<br />
2010<br />
<strong>2011</strong><br />
Figure 9.8.<br />
Multidimensional scaling plots showing similarities between <strong>the</strong> fish communities sampled at<br />
four sites within Small <strong>Bay</strong> during 1994, 2005, 2007, 2008, 2009, 2010 and <strong>2011</strong> sampling<br />
events.<br />
208<br />
ANCHOR<br />
e n v i r o n m en t a l


