Introduction to Digital Signal and System Analysis - Tutorsindia
Introduction to Digital Signal and System Analysis - Tutorsindia
Introduction to Digital Signal and System Analysis - Tutorsindia

Create successful ePaper yourself
Turn your PDF publications into a flip-book with our unique Google optimized e-Paper software.
<strong>Introduction</strong> <strong>to</strong> <strong>Digital</strong> <strong>Signal</strong> <strong>and</strong> <strong>System</strong> <strong>Analysis</strong><br />
Spectral <strong>Analysis</strong> by DFT<br />
⎛ n ⎞<br />
x[<br />
n]<br />
= sin⎜2p<br />
⎟<br />
⎝ 1024 ⎠<br />
(7.1)<br />
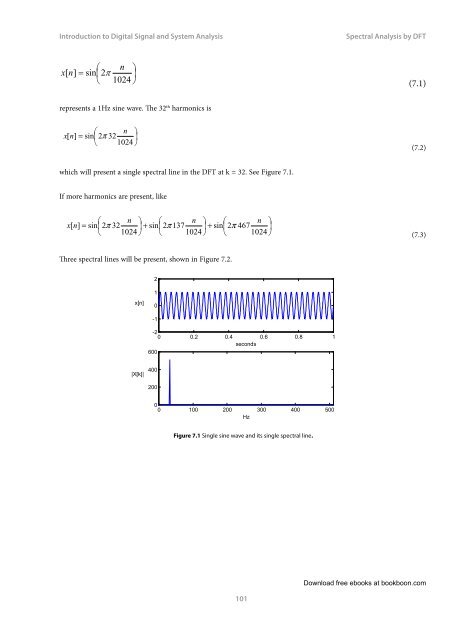
represents a 1Hz sine wave. The 32 th harmonics is<br />
n <br />
x[<br />
n]<br />
= sin2π<br />
32 <br />
1024 <br />
(7.2)<br />
which will present a single spectral line in the DFT at k = 32. See Figure 7.1.<br />
If more harmonics are present, like<br />
n n n <br />
x[<br />
n]<br />
= sin2π<br />
32 + sin2π<br />
137 + sin2π<br />
467 <br />
1024 1024 1024 <br />
(7.3)<br />
Three spectral lines will be present, shown in Figure 7.2.<br />
2<br />
x[n]<br />
1<br />
0<br />
-1<br />
-2<br />
0 0.2 0.4 0.6 0.8 1<br />
seconds<br />
600<br />
|X[k]|<br />
400<br />
200<br />
0<br />
0 100 200 300 400 500<br />
Hz<br />
Figure 7.1 Single sine wave <strong>and</strong> its single spectral line.<br />
101<br />
Download free ebooks at bookboon.com