Central Rice Research Institute Annual report...2011-12
Central Rice Research Institute Annual report...2011-12
Central Rice Research Institute Annual report...2011-12

You also want an ePaper? Increase the reach of your titles
YUMPU automatically turns print PDFs into web optimized ePapers that Google loves.
Enhancing and Sustaining the Productivity of <strong>Rice</strong> Based Farming Systems<br />
Long term–assessment of<br />
soil quality and resilience<br />
in rice-rice system<br />
The long term effect of nutrient<br />
management practices on soil<br />
physical, chemical and biological<br />
properties was studied for<br />
proper interpretation of the yield<br />
changes and development of soil<br />
quality indices. Keeping this, in<br />
view after 41 years of rice-rice<br />
system, the detailed soil analysis<br />
was conducted to find out the<br />
effects of nutrient management<br />
practices on soil properties in a<br />
subtropical rice–rice system.To<br />
determine a soil quality index,<br />
sustainable yield index was<br />
taken as the goal. The minimum<br />
data set (MDS) of indicators that<br />
best represent soil function were<br />
selected and scoring of MDS indicators<br />
based on their performance<br />
of soil function was done.<br />
Finally indicator scores were integrated<br />
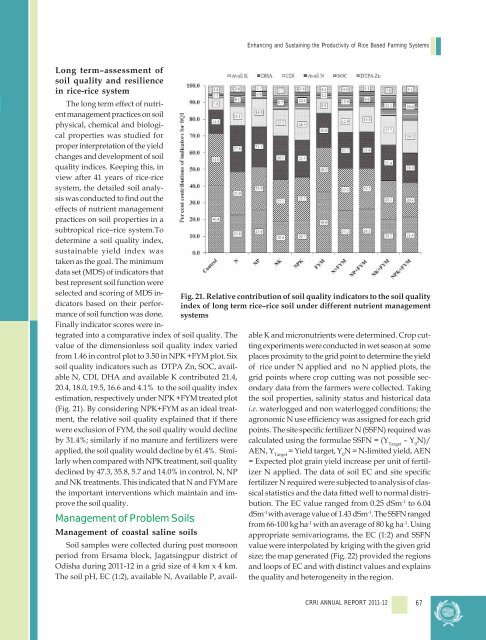
into a comparative index of soil quality. The<br />
value of the dimensionless soil quality index varied<br />
from 1.46 in control plot to 3.50 in NPK +FYM plot. Six<br />
soil quality indicators such as DTPA Zn, SOC, available<br />
N, CDI, DHA and available K contributed 21.4,<br />
20.4, 18.0, 19.5, 16.6 and 4.1% to the soil quality index<br />
estimation, respectively under NPK +FYM treated plot<br />
(Fig. 21). By considering NPK+FYM as an ideal treatment,<br />
the relative soil quality explained that if there<br />
were exclusion of FYM, the soil quality would decline<br />
by 31.4%; similarly if no manure and fertilizers were<br />
applied, the soil quality would decline by 61.4%. Similarly<br />
when compared with NPK treatment, soil quality<br />
declined by 47.3, 35.8, 5.7 and 14.0% in control, N, NP<br />
and NK treatments. This indicated that N and FYM are<br />
the important interventions which maintain and improve<br />
the soil quality.<br />
Management of Problem Soils<br />
Management of coastal saline soils<br />
Soil samples were collected during post monsoon<br />
period from Ersama block, Jagatsingpur district of<br />
Odisha during 2011-<strong>12</strong> in a grid size of 4 km x 4 km.<br />
The soil pH, EC (1:2), available N, Available P, avail-<br />
Fig. 21. Relative contribution of soil quality indicators to the soil quality<br />
index of long term rice–rice soil under different nutrient management<br />
systems<br />
able K and micronutrients were determined. Crop cutting<br />
experiments were conducted in wet season at some<br />
places proximity to the grid point to determine the yield<br />
of rice under N applied and no N applied plots, the<br />
grid points where crop cutting was not possible secondary<br />
data from the farmers were collected. Taking<br />
the soil properties, salinity status and historical data<br />
i.e. waterlogged and non waterlogged conditions; the<br />
agronomic N use efficiency was assigned for each grid<br />
points. The site specific fertilizer N (SSFN) required was<br />
calculated using the formulae SSFN = (Y Target<br />
– Y 0<br />
N)/<br />
AEN, Y Target<br />
= Yield target, Y 0<br />
N = N-limited yield, AEN<br />
= Expected plot grain yield increase per unit of fertilizer<br />
N applied. The data of soil EC and site specific<br />
fertilizer N required were subjected to analysis of classical<br />
statistics and the data fitted well to normal distribution.<br />
The EC value ranged from 0.25 dSm -1 to 6.04<br />
dSm -1 with average value of 1.43 dSm -1 . The SSFN ranged<br />
from 66-100 kg ha -1 with an average of 80 kg ha -1 . Using<br />
appropriate semivariograms, the EC (1:2) and SSFN<br />
value were interpolated by kriging with the given grid<br />
size; the map generated (Fig. 22) provided the regions<br />
and loops of EC and with distinct values and explains<br />
the quality and heterogeneity in the region.<br />
CRRI ANNUAL REPORT 2011-<strong>12</strong><br />
67