Central Rice Research Institute Annual report...2011-12
Central Rice Research Institute Annual report...2011-12
Central Rice Research Institute Annual report...2011-12

Create successful ePaper yourself
Turn your PDF publications into a flip-book with our unique Google optimized e-Paper software.
Socio-economic <strong>Research</strong> for Sustainable Development<br />
Developing entrepreneurial modules of<br />
selected CRRI technologies for training<br />
potential entrepreneurs-a process study<br />
A five week duration Trainer’s Training Module for<br />
entrepreneurship development on CRRI <strong>Rice</strong> Technology<br />
(TED-CRiT) on commercial (50 acre), medium (7.5<br />
acre) and small (0.5 acre) rice-fish integrated farming<br />
systems models was developed which contained sub<br />
modules such as entrepreneurial motivation, general<br />
management, finance management, production management,<br />
labour management, marketing management<br />
and business plan. Each sub modules contained ELC<br />
based sessions. A detailed lesson plan was developed<br />
for each session which was further refined and finalized.<br />
The business plans were based on the data validated<br />
during the last year. The total costs of these<br />
projects were Rs.38.8 lacs, Rs.22.6 lacs and Rs.1.26 lacs,<br />
respectively while the total working capital requirements<br />
were Rs. 10.5 lacs, Rs. 3.5 lacs and Rs. 0.85 lacs,<br />
respectively. The training module on integrated ricefish<br />
farming was refined and tested with a group of 15<br />
farmers and farmwomen. The Trainer’s Training Module<br />
for entrepreneurship development on CRRI <strong>Rice</strong><br />
Technology (TED-CRiT) can be utilized by various extension<br />
agencies to disseminate the CRRI technology.<br />
Simulation of adoption of rice production<br />
technology<br />
In order to simulate adoption of rice production technology,<br />
Pooja rice variety was selected as technology<br />
and data was collected<br />
from 81 respondents of<br />
Arada village of Cuttack<br />
district. CRRI/KVK staff<br />
(74.1%), fellow farmers<br />
(17.3%) and extension<br />
workers (8.6%) were the<br />
main sources of information<br />
regarding Pooja<br />
while, the mass media<br />
exposure of the majority<br />
of respondents (82.7%)<br />
was low. Similarly,<br />
about 46.9% of respondents<br />
had no exposure to<br />
technology demonstration.<br />
However, more than<br />
88.9% of respondents<br />
had good to excellent<br />
perception of technological<br />
characteristics of Pooja and 59% of respondents belonged<br />
to middle and high income group.<br />
Various linear and non-linear models were fitted to<br />
the above data set to obtain mathematical models for<br />
different segments of simulation programme including<br />
mathematical relationship between adoption and independent<br />
variables. Both logit and probit models were<br />
tested with the data for its suitability and probit model<br />
was found to be more suitable for developing simulation<br />
model. The simulation model developed based on<br />
the data analyzed using SPSS and probit model was<br />
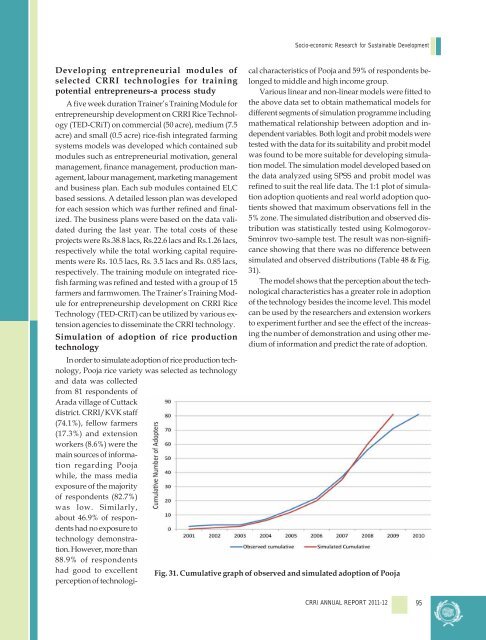
refined to suit the real life data. The 1:1 plot of simulation<br />
adoption quotients and real world adoption quotients<br />
showed that maximum observations fell in the<br />
5% zone. The simulated distribution and observed distribution<br />
was statistically tested using Kolmogorov-<br />
Sminrov two-sample test. The result was non-significance<br />
showing that there was no difference between<br />
simulated and observed distributions (Table 48 & Fig.<br />
31).<br />
The model shows that the perception about the technological<br />
characteristics has a greater role in adoption<br />
of the technology besides the income level. This model<br />
can be used by the researchers and extension workers<br />
to experiment further and see the effect of the increasing<br />
the number of demonstration and using other medium<br />
of information and predict the rate of adoption.<br />
Fig. 31. Cumulative graph of observed and simulated adoption of Pooja<br />
CRRI ANNUAL REPORT 2011-<strong>12</strong><br />
95