Central Rice Research Institute Annual report...2011-12
Central Rice Research Institute Annual report...2011-12
Central Rice Research Institute Annual report...2011-12

You also want an ePaper? Increase the reach of your titles
YUMPU automatically turns print PDFs into web optimized ePapers that Google loves.
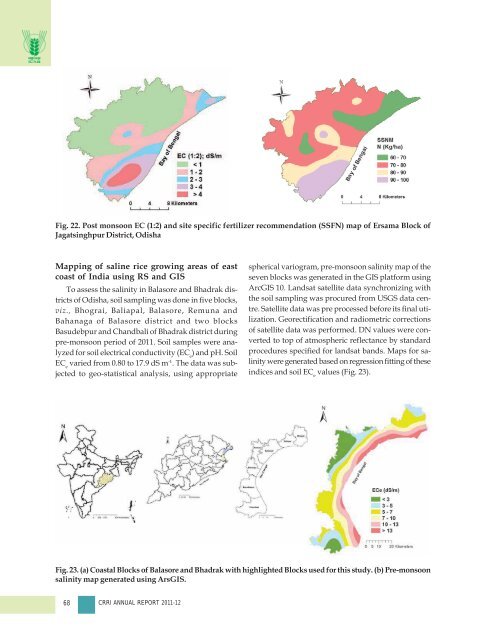
Fig. 22. Post monsoon EC (1:2) and site specific fertilizer recommendation (SSFN) map of Ersama Block of<br />
Jagatsinghpur District, Odisha<br />
Mapping of saline rice growing areas of east<br />
coast of India using RS and GIS<br />
To assess the salinity in Balasore and Bhadrak districts<br />
of Odisha, soil sampling was done in five blocks,<br />
viz., Bhograi, Baliapal, Balasore, Remuna and<br />
Bahanaga of Balasore district and two blocks<br />
Basudebpur and Chandbali of Bhadrak district during<br />
pre-monsoon period of 2011. Soil samples were analyzed<br />
for soil electrical conductivity (EC e<br />
) and pH. Soil<br />
EC e<br />
varied from 0.80 to 17.9 dS m -1 . The data was subjected<br />
to geo-statistical analysis, using appropriate<br />
spherical variogram, pre-monsoon salinity map of the<br />
seven blocks was generated in the GIS platform using<br />
ArcGIS 10. Landsat satellite data synchronizing with<br />
the soil sampling was procured from USGS data centre.<br />
Satellite data was pre processed before its final utilization.<br />
Georectification and radiometric corrections<br />
of satellite data was performed. DN values were converted<br />
to top of atmospheric reflectance by standard<br />
procedures specified for landsat bands. Maps for salinity<br />
were generated based on regression fitting of these<br />
indices and soil EC e<br />
values (Fig. 23).<br />
Fig. 23. (a) Coastal Blocks of Balasore and Bhadrak with highlighted Blocks used for this study. (b) Pre-monsoon<br />
salinity map generated using ArsGIS.<br />
68 CRRI ANNUAL REPORT 2011-<strong>12</strong>