Central Rice Research Institute Annual report...2011-12
Central Rice Research Institute Annual report...2011-12
Central Rice Research Institute Annual report...2011-12

You also want an ePaper? Increase the reach of your titles
YUMPU automatically turns print PDFs into web optimized ePapers that Google loves.
Socio-economic <strong>Research</strong> for Sustainable Development<br />
Socio-economic <strong>Research</strong><br />
for Sustainable Development<br />
Database Creation<br />
Creation of database on rice related<br />
information<br />
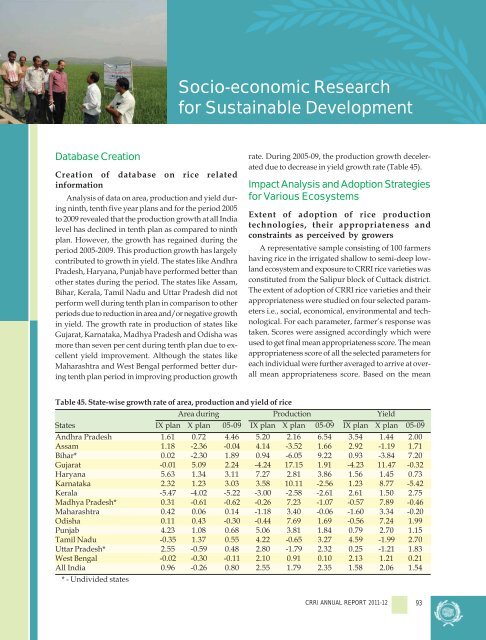
Analysis of data on area, production and yield during<br />
ninth, tenth five year plans and for the period 2005<br />
to 2009 revealed that the production growth at all India<br />
level has declined in tenth plan as compared to ninth<br />
plan. However, the growth has regained during the<br />
period 2005-2009. This production growth has largely<br />
contributed to growth in yield. The states like Andhra<br />
Pradesh, Haryana, Punjab have performed better than<br />
other states during the period. The states like Assam,<br />
Bihar, Kerala, Tamil Nadu and Uttar Pradesh did not<br />
perform well during tenth plan in comparison to other<br />
periods due to reduction in area and/or negative growth<br />
in yield. The growth rate in production of states like<br />
Gujarat, Karnataka, Madhya Pradesh and Odisha was<br />
more than seven per cent during tenth plan due to excellent<br />
yield improvement. Although the states like<br />
Maharashtra and West Bengal performed better during<br />
tenth plan period in improving production growth<br />
rate. During 2005-09, the production growth decelerated<br />
due to decrease in yield growth rate (Table 45).<br />
Impact Analysis and Adoption Strategies<br />
for Various Ecosystems<br />
Extent of adoption of rice production<br />
technologies, their appropriateness and<br />
constraints as perceived by growers<br />
A representative sample consisting of 100 farmers<br />
having rice in the irrigated shallow to semi-deep lowland<br />
ecosystem and exposure to CRRI rice varieties was<br />
constituted from the Salipur block of Cuttack district.<br />
The extent of adoption of CRRI rice varieties and their<br />
appropriateness were studied on four selected parameters<br />
i.e., social, economical, environmental and technological.<br />
For each parameter, farmer’s response was<br />
taken. Scores were assigned accordingly which were<br />
used to get final mean appropriateness score. The mean<br />
appropriateness score of all the selected parameters for<br />
each individual were further averaged to arrive at overall<br />
mean appropriateness score. Based on the mean<br />
Table 45. State-wise growth rate of area, production and yield of rice<br />
Area during Production Yield<br />
States IX plan X plan 05-09 IX plan X plan 05-09 IX plan X plan 05-09<br />
Andhra Pradesh 1.61 0.72 4.46 5.20 2.16 6.54 3.54 1.44 2.00<br />
Assam 1.18 -2.36 -0.04 4.14 -3.52 1.66 2.92 -1.19 1.71<br />
Bihar* 0.02 -2.30 1.89 0.94 -6.05 9.22 0.93 -3.84 7.20<br />
Gujarat -0.01 5.09 2.24 -4.24 17.15 1.91 -4.23 11.47 -0.32<br />
Haryana 5.63 1.34 3.11 7.27 2.81 3.86 1.56 1.45 0.73<br />
Karnataka 2.32 1.23 3.03 3.58 10.11 -2.56 1.23 8.77 -5.42<br />
Kerala -5.47 -4.02 -5.22 -3.00 -2.58 -2.61 2.61 1.50 2.75<br />
Madhya Pradesh* 0.31 -0.61 -0.62 -0.26 7.23 -1.07 -0.57 7.89 -0.46<br />
Maharashtra 0.42 0.06 0.14 -1.18 3.40 -0.06 -1.60 3.34 -0.20<br />
Odisha 0.11 0.43 -0.30 -0.44 7.69 1.69 -0.56 7.24 1.99<br />
Punjab 4.23 1.08 0.68 5.06 3.81 1.84 0.79 2.70 1.15<br />
Tamil Nadu -0.35 1.37 0.55 4.22 -0.65 3.27 4.59 -1.99 2.70<br />
Uttar Pradesh* 2.55 -0.59 0.48 2.80 -1.79 2.32 0.25 -1.21 1.83<br />
West Bengal -0.02 -0.30 -0.11 2.10 0.91 0.10 2.13 1.21 0.21<br />
All India 0.96 -0.26 0.80 2.55 1.79 2.35 1.58 2.06 1.54<br />
* - Undivided states<br />
CRRI ANNUAL REPORT 2011-<strong>12</strong><br />
93