Central Rice Research Institute Annual report...2011-12
Central Rice Research Institute Annual report...2011-12
Central Rice Research Institute Annual report...2011-12

You also want an ePaper? Increase the reach of your titles
YUMPU automatically turns print PDFs into web optimized ePapers that Google loves.
Table 48. Kolgomogorov-Sminrov two sample test between<br />
simulate and observed values<br />
Observed Simulated |S m<br />
(x)-S m<br />
’(x)|<br />
S m<br />
(x) S m<br />
’(x)<br />
2001 0.02 0.00 0.02<br />
2002 0.04 0.01 0.02<br />
2003 0.04 0.02 0.01<br />
2004 0.09 0.07 0.01<br />
2005 0.17 0.15 0.02<br />
2006 0.27 0.25 0.02<br />
2007 0.46 0.43 0.02<br />
2008 0.69 0.74 0.05<br />
2009 0.88 1.00 0.<strong>12</strong> max<br />
2010 1.00<br />
Market and Policy <strong>Research</strong><br />
Impact of WTO on global rice exports with<br />
particular reference to India<br />
The country wise export and import data on rice for<br />
the period 1961 to 2008 were analyzed. The analysis<br />
revealed that the share of world rice trade in total rice<br />
production has expanded from 4.3% during 1960s to<br />
7.0% during the recent period. The rice trade volume<br />
has increased from 7.5 m tonnes per year during 1960s<br />
to 28.6 mt during the last decade. Though India was a<br />
major importer during 1960s, it has turned out to be a<br />
major exporter after the 1994 GATT agreement and occupies<br />
third position next to Thailand and Vietnam.<br />
China was the second largest exporter during 1970s<br />
and its position has been relegated to sixth during the<br />
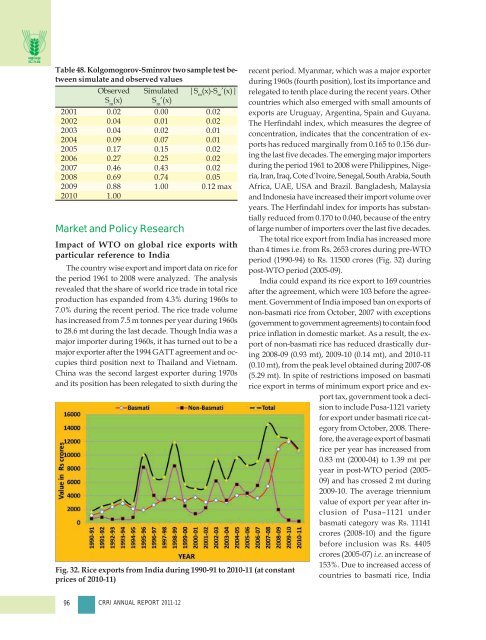
Fig. 32. <strong>Rice</strong> exports from India during 1990-91 to 2010-11 (at constant<br />
prices of 2010-11)<br />
recent period. Myanmar, which was a major exporter<br />
during 1960s (fourth position), lost its importance and<br />
relegated to tenth place during the recent years. Other<br />
countries which also emerged with small amounts of<br />
exports are Uruguay, Argentina, Spain and Guyana.<br />
The Herfindahl index, which measures the degree of<br />
concentration, indicates that the concentration of exports<br />
has reduced marginally from 0.165 to 0.156 during<br />
the last five decades. The emerging major importers<br />
during the period 1961 to 2008 were Philippines, Nigeria,<br />
Iran, Iraq, Cote d’Ivoire, Senegal, South Arabia, South<br />
Africa, UAE, USA and Brazil. Bangladesh, Malaysia<br />
and Indonesia have increased their import volume over<br />
years. The Herfindahl index for imports has substantially<br />
reduced from 0.170 to 0.040, because of the entry<br />
of large number of importers over the last five decades.<br />
The total rice export from India has increased more<br />
than 4 times i.e. from Rs. 2653 crores during pre-WTO<br />
period (1990-94) to Rs. 11500 crores (Fig. 32) during<br />
post-WTO period (2005-09).<br />
India could expand its rice export to 169 countries<br />
after the agreement, which were 103 before the agreement.<br />
Government of India imposed ban on exports of<br />
non-basmati rice from October, 2007 with exceptions<br />
(government to government agreements) to contain food<br />
price inflation in domestic market. As a result, the export<br />
of non-basmati rice has reduced drastically during<br />
2008-09 (0.93 mt), 2009-10 (0.14 mt), and 2010-11<br />
(0.10 mt), from the peak level obtained during 2007-08<br />
(5.29 mt). In spite of restrictions imposed on basmati<br />
rice export in terms of minimum export price and export<br />
tax, government took a decision<br />
to include Pusa-1<strong>12</strong>1 variety<br />
for export under basmati rice category<br />
from October, 2008. Therefore,<br />
the average export of basmati<br />
rice per year has increased from<br />
0.83 mt (2000-04) to 1.39 mt per<br />
year in post-WTO period (2005-<br />
09) and has crossed 2 mt during<br />
2009-10. The average triennium<br />
value of export per year after inclusion<br />
of Pusa–1<strong>12</strong>1 under<br />
basmati category was Rs. 11141<br />
crores (2008-10) and the figure<br />
before inclusion was Rs. 4405<br />
crores (2005-07) i.e. an increase of<br />
153%. Due to increased access of<br />
countries to basmati rice, India<br />
96 CRRI ANNUAL REPORT 2011-<strong>12</strong>