Central Rice Research Institute Annual report...2011-12
Central Rice Research Institute Annual report...2011-12
Central Rice Research Institute Annual report...2011-12

You also want an ePaper? Increase the reach of your titles
YUMPU automatically turns print PDFs into web optimized ePapers that Google loves.
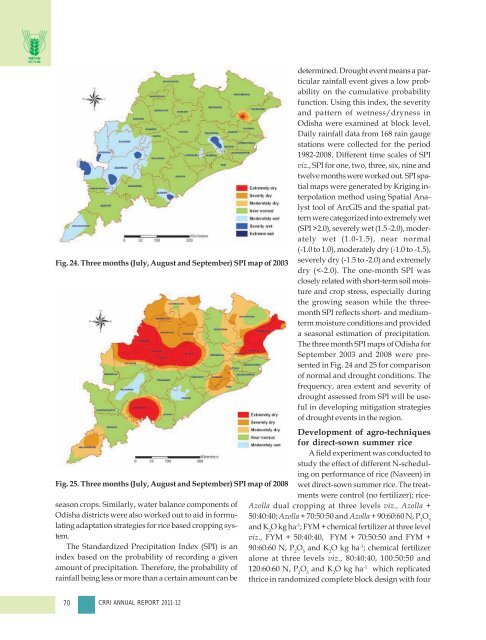
Fig. 24. Three months (July, August and September) SPI map of 2003<br />
Fig. 25. Three months (July, August and September) SPI map of 2008<br />
season crops. Similarly, water balance components of<br />
Odisha districts were also worked out to aid in formulating<br />
adaptation strategies for rice based cropping system.<br />
The Standardized Precipitation Index (SPI) is an<br />
index based on the probability of recording a given<br />
amount of precipitation. Therefore, the probability of<br />
rainfall being less or more than a certain amount can be<br />
determined. Drought event means a particular<br />
rainfall event gives a low probability<br />
on the cumulative probability<br />
function. Using this index, the severity<br />
and pattern of wetness/dryness in<br />
Odisha were examined at block level.<br />
Daily rainfall data from 168 rain gauge<br />
stations were collected for the period<br />
1982-2008. Different time scales of SPI<br />
viz., SPI for one, two, three, six, nine and<br />
twelve months were worked out. SPI spatial<br />
maps were generated by Kriging interpolation<br />
method using Spatial Analyst<br />
tool of ArcGIS and the spatial pattern<br />
were categorized into extremely wet<br />
(SPI >2.0), severely wet (1.5 -2.0), moderately<br />
wet (1.0-1.5), near normal<br />
(-1.0 to 1.0), moderately dry (-1.0 to -1.5),<br />
severely dry (-1.5 to -2.0) and extremely<br />
dry (