Annual Report 2005 - Chubb Group of Insurance Companies
Annual Report 2005 - Chubb Group of Insurance Companies
Annual Report 2005 - Chubb Group of Insurance Companies

Create successful ePaper yourself
Turn your PDF publications into a flip-book with our unique Google optimized e-Paper software.
EXECUTIVE OVERVIEW<br />
The following highlights do not address all <strong>of</strong> the matters covered in the other sections <strong>of</strong><br />
Management's Discussion and Analysis <strong>of</strong> Financial Condition and Results <strong>of</strong> Operations or contain all <strong>of</strong><br />
the information that may be important to <strong>Chubb</strong>'s shareholders or the investing public. This overview<br />
should be read in conjunction with the other sections <strong>of</strong> Management's Discussion and Analysis <strong>of</strong><br />
Financial Condition and Results <strong>of</strong> Operations.<br />
‚Net income was $1,826 million in <strong>2005</strong> compared with $1,548 million in 2004 and $809 million in<br />
2003. The increase in net income in <strong>2005</strong> was driven by increases in both underwriting and<br />
investment income in our property and casualty insurance business.<br />
‚Underwriting results in <strong>2005</strong> were adversely aÅected by pre-tax costs <strong>of</strong> $462 million related to<br />
Hurricane Katrina, including estimated net losses <strong>of</strong> $403 million and net reinsurance reinstatement<br />
premium costs <strong>of</strong> $59 million. We also incurred a charge <strong>of</strong> about $45 million, included in<br />
our corporate segment, representing our share <strong>of</strong> the losses from Hurricane Katrina estimated<br />
by an insurer in which we have a minority interest.<br />
‚Despite the impact <strong>of</strong> Hurricane Katrina, underwriting results were highly proÑtable in <strong>2005</strong> as<br />
they were in 2004, compared with modestly proÑtable results in 2003. Our combined loss and<br />
expense ratio was 92.3% in both <strong>2005</strong> and 2004 compared with 98.0% in 2003.<br />
‚Premium growth was 2% in <strong>2005</strong> and 9% in 2004. Premiums in our insurance business grew 4% in<br />
<strong>2005</strong> and 8% in 2004. The lower growth in <strong>2005</strong> reÖects our maintaining underwriting discipline<br />
in a more competitive market environment. Rates were generally stable, but were under<br />
competitive pressure in some classes <strong>of</strong> business. In our reinsurance assumed business, premiums<br />
decreased 21% in <strong>2005</strong> after increasing 16% in 2004. The decrease in <strong>2005</strong> was in line with<br />
our expectations as we had anticipated fewer attractive opportunities in the reinsurance market.<br />
‚During <strong>2005</strong>, we experienced overall unfavorable development <strong>of</strong> $163 million on loss reserves<br />
established as <strong>of</strong> the previous year end, due primarily to unfavorable development in the<br />
pr<strong>of</strong>essional liability classes <strong>of</strong> business, principally errors and omissions liability, and in excess<br />
liability and certain other commercial liability classes, oÅset in part by favorable development in<br />
the property classes and in Ñdelity and surety.<br />
‚Property and casualty investment income after taxes increased by 11% in <strong>2005</strong> and 13% in 2004.<br />
‚In December <strong>2005</strong>, we completed a transaction involving a new reinsurance company, Harbor<br />
Point Limited. As part <strong>of</strong> the transaction, we transferred our continuing reinsurance assumed<br />
business and certain related assets, including renewal rights, to Harbor Point. The transaction<br />
resulted in the recognition <strong>of</strong> a pre-tax realized investment gain <strong>of</strong> $171 million in <strong>2005</strong>.<br />
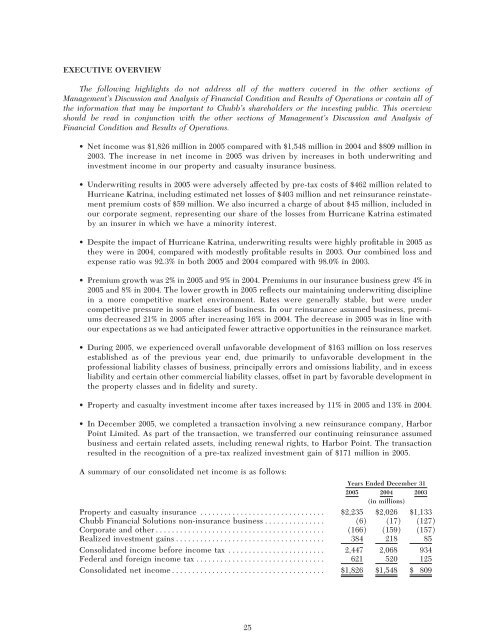
A summary <strong>of</strong> our consolidated net income is as follows:<br />
Years Ended December 31<br />
<strong>2005</strong> 2004 2003<br />
(in millions)<br />
Property and casualty insurance ÏÏÏÏÏÏÏÏÏÏÏÏÏÏÏÏÏÏÏÏÏÏÏÏÏÏÏÏÏÏÏ $2,235 $2,026 $1,133<br />
<strong>Chubb</strong> Financial Solutions non-insurance businessÏÏÏÏÏÏÏÏÏÏÏÏÏÏÏ (6) (17) (127)<br />
Corporate and otherÏÏÏÏÏÏÏÏÏÏÏÏÏÏÏÏÏÏÏÏÏÏÏÏÏÏÏÏÏÏÏÏÏÏÏÏÏÏÏÏÏÏ (166) (159) (157)<br />
Realized investment gainsÏÏÏÏÏÏÏÏÏÏÏÏÏÏÏÏÏÏÏÏÏÏÏÏÏÏÏÏÏÏÏÏÏÏÏÏÏ 384 218 85<br />
Consolidated income before income tax ÏÏÏÏÏÏÏÏÏÏÏÏÏÏÏÏÏÏÏÏÏÏÏÏ 2,447 2,068 934<br />
Federal and foreign income taxÏÏÏÏÏÏÏÏÏÏÏÏÏÏÏÏÏÏÏÏÏÏÏÏÏÏÏÏÏÏÏÏ 621 520 125<br />
Consolidated net incomeÏÏÏÏÏÏÏÏÏÏÏÏÏÏÏÏÏÏÏÏÏÏÏÏÏÏÏÏÏÏÏÏÏÏÏÏÏÏ $1,826 $1,548 $ 809<br />
25