OECD (2000)
OECD (2000)
OECD (2000)

Create successful ePaper yourself
Turn your PDF publications into a flip-book with our unique Google optimized e-Paper software.
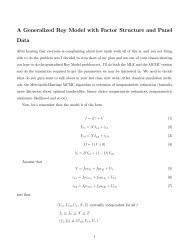
Students Receiving Additional Resources to Access the Curriculum<br />
To provide a basis for comparisons, countries have now located their own<br />
national categories used to identify students with disabilities, learning difficulties<br />
and disadvantages within a simple, tri-partite international taxonomy.<br />
Category A in this taxonomy corresponds broadly to needs arising from impairing<br />
conditions; category B includes those experiencing learning or behaviour<br />
difficulties for no clear reason and category C covers students from disadvantaged<br />
backgrounds (see definitions below). The different frameworks that<br />
countries bring to bear in providing for these students were presented in<br />
Indicator C6 of Education at a Glance 1998. The analysis reveals that some countries<br />
include only students with medical disabilities, or category A students, in<br />
their national categories (e.g., the Czech Republic, Italy) while Turkey and Spain<br />
include gifted and talented and yet others include those who are disadvantaged<br />
in various ways (e.g. Switzerland).<br />
Different countries identify very different proportions of students in<br />
categories A, B, and C as being in need of additional support even though some<br />
of the variation may be due to some differences in the way the categories are<br />
interpreted. Chart C6.1 show the substantial differences between countries in<br />
terms of the proportion of students identified as receiving additional resources<br />
to help them access the curriculum. The proportion of students receiving<br />
additional resources ranges from 35 per cent of all students in primary and lower<br />
secondary education to less than 1 per cent. Where possible data are shown for<br />
cross-national categories A, B and C separately as proportions of all students in<br />
primary and lower secondary education. In countries with high proportions of<br />
students receiving additional resources, most of them are classified in crossnational<br />
category C. Education at a Glance 1998 (Table C6.5) provided a proxy of the<br />
extent of the additional resources provided through improved student to<br />
teacher ratios. For category A students, ratios ranged from 2.3 to 8.6 for students<br />
in special schools and 1.7 to 10.7 in special classes in regular schools. These<br />
figures may be contrasted with ratios in regular classes ranging from 9.5 to 27.9.<br />
Thus is it clear that the additional resources provided may be substantial and act<br />
as a positive discrimination for students with the greatest difficulties.<br />
Location of students with disabilities, learning, behavioural or emotional<br />
difficulties, and disadvantages<br />
There is particular policy interest in the place or location of the education of<br />
students with disabilities. Chart C6.2 shows where these students (classified as<br />
cross-national category A) are being educated, which may be in either special<br />
schools, special classes or regular classes. The differences are particularly striking<br />
with some countries having virtually no disabled students in special schools<br />
(e.g. Italy) while some others have over two-thirds in special schools (e.g. Finland,<br />
France, Greece, and the Netherlands). Debate continues over the desirability or<br />
otherwise of including category A students in regular schools, and this indicator<br />
responds to the need to monitor the changing situation.<br />
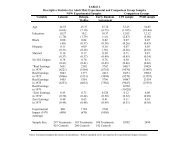
The distribution of students receiving additional resources by location<br />
differs by categories. Table C6.3 reveals the distribution of students by<br />
location broken down by cross-national categories A, B and C.<br />
Table C6.4 summarises data on special schools. Chart C6.3, shows the<br />
number of special schools per 100 000 of the total primary and lower secondary<br />
school population and reveals large variations between countries (e.g. 1.6 in<br />
Italy versus 72.4 in the Czech Republic).<br />
Category A corresponds<br />
broadly to needs arising<br />
from impairing<br />
conditions; category B<br />
includes those<br />
experiencing difficulties<br />
in learning for no clear<br />
reason and category C<br />
covers students<br />
from disadvantaged<br />
backgrounds.<br />
The proportion<br />
of students receiving<br />
additional resources<br />
ranges from 35 per cent<br />
of all students<br />
in primary and lower<br />
secondary education<br />
to less than 1 per cent.<br />
There are striking<br />
differences between<br />
countries in terms<br />
of where disabled<br />
students in category A<br />
are educated, which<br />
may be in either special<br />
schools, special classes<br />
or regular classes.<br />
C6<br />
© <strong>OECD</strong> <strong>2000</strong><br />
189