OECD (2000)
OECD (2000)
OECD (2000)

Create successful ePaper yourself
Turn your PDF publications into a flip-book with our unique Google optimized e-Paper software.
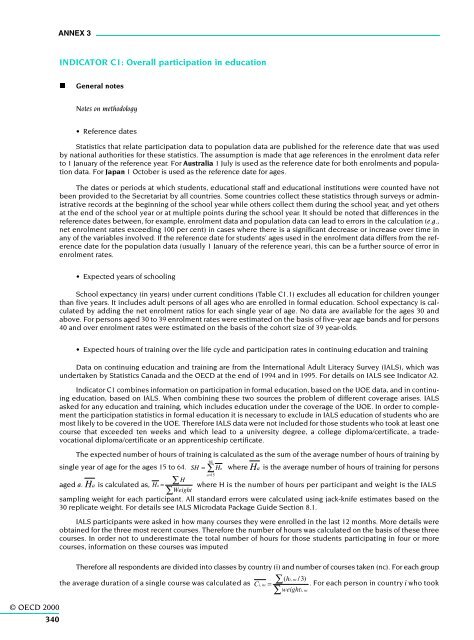
ANNEX 3<br />
INDICATOR C1: Overall participation in education<br />
<br />
General notes<br />
Notes on methodology<br />
• Reference dates<br />
Statistics that relate participation data to population data are published for the reference date that was used<br />
by national authorities for these statistics. The assumption is made that age references in the enrolment data refer<br />
to 1 January of the reference year. For Australia 1 July is used as the reference date for both enrolments and population<br />
data. For Japan 1 October is used as the reference date for ages.<br />
The dates or periods at which students, educational staff and educational institutions were counted have not<br />
been provided to the Secretariat by all countries. Some countries collect these statistics through surveys or administrative<br />
records at the beginning of the school year while others collect them during the school year, and yet others<br />
at the end of the school year or at multiple points during the school year. It should be noted that differences in the<br />
reference dates between, for example, enrolment data and population data can lead to errors in the calculation (e.g.,<br />
net enrolment rates exceeding 100 per cent) in cases where there is a significant decrease or increase over time in<br />
any of the variables involved. If the reference date for students’ ages used in the enrolment data differs from the reference<br />
date for the population data (usually 1 January of the reference year), this can be a further source of error in<br />
enrolment rates.<br />
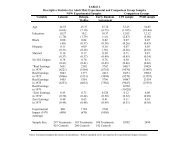
• Expected years of schooling<br />
School expectancy (in years) under current conditions (Table C1.1) excludes all education for children younger<br />
than five years. It includes adult persons of all ages who are enrolled in formal education. School expectancy is calculated<br />
by adding the net enrolment ratios for each single year of age. No data are available for the ages 30 and<br />
above. For persons aged 30 to 39 enrolment rates were estimated on the basis of five-year age bands and for persons<br />
40 and over enrolment rates were estimated on the basis of the cohort size of 39 year-olds.<br />
© <strong>OECD</strong> <strong>2000</strong><br />
340<br />
• Expected hours of training over the life cycle and participation rates in continuing education and training<br />
Data on continuing education and training are from the International Adult Literacy Survey (IALS), which was<br />
undertaken by Statistics Canada and the <strong>OECD</strong> at the end of 1994 and in 1995. For details on IALS see Indicator A2.<br />
Indicator C1 combines information on participation in formal education, based on the UOE data, and in continuing<br />
education, based on IALS. When combining these two sources the problem of different coverage arises. IALS<br />
asked for any education and training, which includes education under the coverage of the UOE. In order to complement<br />
the participation statistics in formal education it is necessary to exclude in IALS education of students who are<br />
most likely to be covered in the UOE. Therefore IALS data were not included for those students who took at least one<br />
course that exceeded ten weeks and which lead to a university degree, a college diploma/certificate, a tradevocational<br />
diploma/certificate or an apprenticeship certificate.<br />
The expected number of hours of training is calculated as the sum of the average number of hours of training by<br />
64<br />
single year of age for the ages 15 to 64. SH = ∑ Ha where Ha<br />
is the average number of hours of training for persons<br />
a=<br />
15<br />
aged a. is calculated as,<br />
∑ H<br />
Ha<br />
Ha = where H is the number of hours per participant and weight is the IALS<br />
∑Weight<br />
sampling weight for each participant. All standard errors were calculated using jack-knife estimates based on the<br />
30 replicate weight. For details see IALS Microdata Package Guide Section 8.1.<br />
IALS participants were asked in how many courses they were enrolled in the last 12 months. More details were<br />
obtained for the three most recent courses. Therefore the number of hours was calculated on the basis of these three<br />
courses. In order not to underestimate the total number of hours for those students participating in four or more<br />
courses, information on these courses was imputed<br />
Therefore all respondents are divided into classes by country (i) and number of courses taken (nc). For each group<br />
the average duration of a single course was calculated as ∑(<br />
hi,<br />
nc /3)<br />
Ci,<br />
nc =<br />
. For each person in country i who took<br />
weighti,<br />
nc<br />
∑