OECD (2000)
OECD (2000)
OECD (2000)

You also want an ePaper? Increase the reach of your titles
YUMPU automatically turns print PDFs into web optimized ePapers that Google loves.
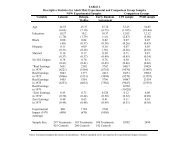
F1<br />
Mathematics Achievement of Students in the 4th and 8th Grades<br />
time. Some of the differences observed could be caused by other factors, such<br />
as changes in curricular emphases and teaching methods at different grades.<br />
Some of the countries<br />
with a comparatively<br />
low performance at the<br />
4th grade make up for<br />
some of the difference<br />
by the 8th grade…<br />
… while other countries<br />
have good 4th-grade<br />
results but fall behind<br />
by the 8th grade.<br />
Iceland, New Zealand and Norway, whose 4th-grade students perform<br />
particularly poorly in mathematics, are among the countries with the highest<br />
gains over the four years. There are also countries with high performance in<br />
4th-grade mathematics which succeed in extending their advantage through<br />
high gains over the four years – Japan and Korea in particular.<br />
At the other end of the spectrum are countries, such as Ireland and the<br />
United States, which perform well at the 4th grade but which fall behind by the<br />
8th grade. Some of the differences between countries may be explained by differences<br />
in curricular emphases at the respective grades.<br />
DEFINITIONS<br />
The achievement scores are based on tests administered as part of the<br />
Third International Mathematics and Science Study (TIMSS) that was undertaken<br />
by the International Association for the Evaluation of Educational<br />
Achievement (IEA) during the school year 1994/95. The target populations<br />
studied in this indicator refer to students in the higher of the two grades in<br />
which most 9- and 13-year-olds are enrolled. Conventionally, these grades are<br />
referred to as the “4th” and “8th” grades, since in most countries they refer to<br />
the fourth and eighth years of formal schooling. It should be noted that years<br />
of formal schooling vary from country to country and that chronological age<br />
does not necessarily mean that students have had the same amount of formal<br />
schooling. For example, students in Denmark, Norway and Sweden have had<br />
one year less (i.e. seven years) of formal schooling than most of their counterparts<br />
in the 8th grade, while students in England, Scotland and New Zealand<br />
have had one year more (i.e. nine years) of formal schooling (see Table F.1.1).<br />
Countries in Table F1.1 and Chart 1.1 marked with (3) or (4) met the IEA/TIMSS<br />
sampling standards only partially, while those marked with (1) or (2) did not<br />
meet the IEA/TIMSS sampling standards. Annex 3 in the 1997 edition of Education<br />
at a Glance gives further details.<br />
For Table F1.1 and Chart 1.1, 4th-grade average achievement scores and<br />
their standard errors (with the exception of those used for the significance<br />
tests at the 4th grade) are adjusted for each country to fit the 8th-grade<br />
achievement scale. Fifteen of the items in mathematics (15 per cent) were<br />
included in the tests for both Population 1 (9-year-olds in grades 3 and 4) and<br />
Population 2 (13-year-olds in grades 7 and 8). The difference in performance in<br />
these items between the populations was used to estimate the change between<br />
the 4th and the 8th grade. The country means for the 4th grade transformed to<br />
the 8th-grade scale are shown in Table F1.1. The tests for Chart F1.1 on whether<br />
the 4th-grade country means are significantly different from the <strong>OECD</strong> mean are<br />
based on standard errors, which are not adjusted for the linkage between 4th<br />
and 8th grades.<br />
The data are subject to sampling error, which sets a lower limit on the size of<br />
observed differences that can be considered statistically significant. The statistical<br />
tests used to compare country means were conducted using the Bonferroni adjustment<br />
for multiple comparisons at the 5 per cent significance level.<br />
© <strong>OECD</strong> <strong>2000</strong><br />
304