OECD (2000)
OECD (2000)
OECD (2000)

You also want an ePaper? Increase the reach of your titles
YUMPU automatically turns print PDFs into web optimized ePapers that Google loves.
B1<br />
Educational Expenditure Relative to Gross Domestic Product<br />
POLICY CONTEXT<br />
This indicator provides<br />
a measure of the relative<br />
proportion of a nation’s<br />
wealth that is invested<br />
in educational<br />
institutions, its origin<br />
and its destination.<br />
It also includes<br />
a comparative review<br />
of changes<br />
in educational<br />
investment over time.<br />
Expenditure on education is an investment that can help to foster<br />
economic growth, enhance productivity, contribute to personal and social<br />
development, and reduce social inequality. The proportion of total financial<br />
resources devoted to education is one of the key choices made in each country,<br />
an aggregate choice made by governments, heads of enterprises, and individual<br />
students and their families. So long as the social and private returns on that<br />
investment are sufficiently large, there is an incentive for enrolment to expand<br />
and total investment to increase.<br />
In appraising how much they spend on education, governments have to<br />
interpret demands for increased spending in areas such as teachers’ salaries and<br />
educational facilities and to assess how effectively existing resources are being<br />
utilised. Although this indicator cannot answer these questions directly, it<br />
provides a point of reference as to how the volume of educational spending,<br />
relative to the size of national wealth, has evolved over time in various countries.<br />
EVIDENCE AND EXPLANATIONS<br />
Overall investment relative to GDP<br />
As a whole, <strong>OECD</strong><br />
countries spend<br />
6.1 per cent<br />
of their combined GDP<br />
in support<br />
of their educational<br />
institutions.<br />
All <strong>OECD</strong> countries invest a substantial proportion of national resources in<br />
education. Taking into account both public and private sources of funds, <strong>OECD</strong><br />
countries as a whole spend 6.1 per cent of their collective GDP in support of their<br />
educational institutions. Under current conditions of tight constraints on public<br />
budgets, such a large spending item is subject to close scrutiny by governments<br />
looking for ways to reduce or limit the growth of expenditure. In only four out of<br />
23 reporting <strong>OECD</strong> countries (Greece, Italy, Japan, and the Netherlands) is less<br />
than 5 per cent of GDP spent on educational institutions (Chart B1.1).<br />
If direct public expenditure, funds from international sources and all<br />
public subsidies to students and households are taken into account, then the<br />
proportion of GDP spent on education in <strong>OECD</strong> countries rises to above 8 per<br />
cent of GDP in Denmark and Sweden, and to between 6.5 and 8 per cent in<br />
Austria, Canada, Finland, and the United States; it remains below 5 per cent in<br />
Greece and Italy.<br />
Many factors influence the relative position of countries on this measure.<br />
For example, high-expenditure countries may be enrolling larger numbers of<br />
students while low-expenditure countries may either be very efficient in<br />
delivering education or be limiting access to higher levels of education; the<br />
distribution of enrolments between sectors and fields of study may differ, as<br />
may the duration of studies; and the scale and organisation of linked research<br />
activities may vary.<br />
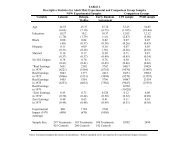
Changes in overall educational spending between 1990 and 1996<br />
In seven out of nine<br />
<strong>OECD</strong> countries, public<br />
and private investment<br />
in education increased<br />
between 1990<br />
and 1996...<br />
In seven out of the nine countries for which comparable trend data are<br />
available, public and private investment in education has increased<br />
between 1990 and 1996 in real terms (Table B1.2). The increase in Australia,<br />
Denmark and Spain amounted to over 20 per cent, and in Ireland to over 40 per<br />
cent. On the other hand, spending in Finland and Hungary was lower in 1996<br />
than in 1990. The trend is similar if only public investment is considered: direct<br />
© <strong>OECD</strong> <strong>2000</strong><br />
44