OECD (2000)
OECD (2000)
OECD (2000)

Create successful ePaper yourself
Turn your PDF publications into a flip-book with our unique Google optimized e-Paper software.
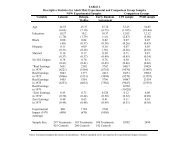
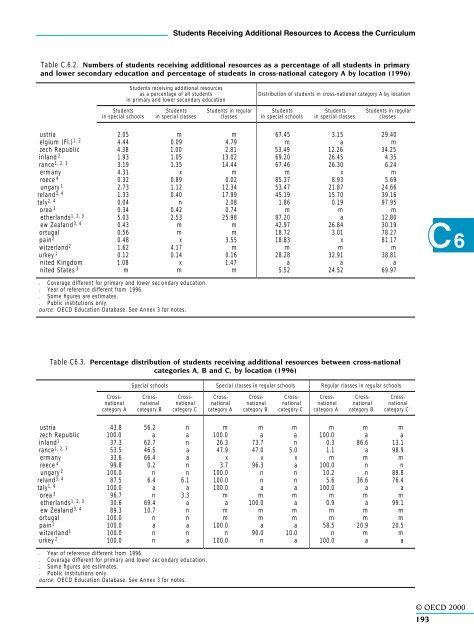
Students Receiving Additional Resources to Access the Curriculum<br />
Table C.6.2. Numbers of students receiving additional resources as a percentage of all students in primary<br />
and lower secondary education and percentage of students in cross-national category A by location (1996)<br />
Students receiving additional resources<br />
as a percentage of all students<br />
in primary and lower secondary education<br />
Distribution of students in cross-national category A by location<br />
Students Students Students in regular Students Students Students in regular<br />
in special schools in special classes classes in special schools in special classes classes<br />
ustria 2.05 m m 67.45 3.15 29.40<br />
elgium (Fl.) 1, 2 4.44 0.09 4.79 m a m<br />
zech Republic 4.38 1.00 2.81 53.49 12.26 34.25<br />
inland 2 1.93 1.05 13.02 69.20 26.45 4.35<br />
rance 1, 2, 3 3.19 1.35 14.44 67.46 26.30 6.24<br />
ermany 4.31 x m m x m<br />
reece 4 0.32 0.89 0.02 85.37 8.93 5.69<br />
ungary 1 2.73 1.12 12.34 53.47 21.87 24.66<br />
reland 3, 4 1.33 0.40 17.99 45.19 15.70 39.16<br />
taly 2, 4 0.04 n 2.08 1.86 0.19 97.95<br />
orea 3 0.34 0.42 0.74 m m m<br />
etherlands 1, 2, 3 5.03 2.53 25.98 87.20 a 12.80<br />
ew Zealand 3, 4 0.43 m m 42.97 26.84 30.19<br />
ortugal 0.56 m m 18.72 3.01 78.27<br />
pain 2 0.48 x 3.55 18.83 x 81.17<br />
witzerland 2 1.62 4.17 m m m m<br />
urkey 1 0.12 0.14 0.16 28.28 32.91 38.81<br />
nited Kingdom 1.08 x 1.47 a a a<br />
nited States 3 m m m 5.52 24.52 69.97<br />
C6<br />
. Coverage different for primary and lower sec ondary education.<br />
. Year of reference different from 1996.<br />
. Some figures are estimates.<br />
. Public institutions only.<br />
ource: <strong>OECD</strong> Education Database. See Annex 3 for notes.<br />
Table C6.3. Percentage distribution of students receiving additional resources between cross-national<br />
categories A, B and C, by location (1996)<br />
Special schools Special classes in regular schools Regular classes in regular schools<br />
Cross- Cross- Cross- Cross- Cross- Cross- Cross- Cross- Crossnational<br />
national national national national national national national national<br />
category A category B category C category A category B category C category A category B category C<br />
ustria 43.8 56.2 n m m m m m m<br />
zech Republic 100.0 a a 100.0 a a 100.0 a a<br />
inland 1 37.3 62.7 n 26.3 73.7 n 0.3 86.6 13.1<br />
rance 1, 2, 3 53.5 46.5 a 47.9 47.0 5.0 1.1 a 98.9<br />
ermany 33.6 66.4 a x x x m m m<br />
reece 4 99.8 0.2 n 3.7 96.3 a 100.0 n n<br />
ungary 2 100.0 n n 100.0 n n 10.2 n 89.8<br />
reland 3, 4 87.5 6.4 6.1 100.0 n n 5.6 36.6 76.4<br />
taly 1, 4 100.0 a a 100.0 a a 100.0 a a<br />
orea 3 96.7 n 3.3 m m m m m m<br />
etherlands 1, 2, 3 30.6 69.4 a a 100.0 a 0.9 a 99.1<br />
ew Zealand 3, 4 89.3 10.7 n m m m m m m<br />
ortugal 100.0 n n m m m m m m<br />
pain 1 100.0 a a 100.0 a a 58.5 20.9 20.5<br />
witzerland 1 100.0 n n n 90.0 10.0 n m m<br />
urkey 2 100.0 n a 100.0 n a 100.0 a a<br />
. Year of reference different from 1996.<br />
. Coverage different for primary and lower sec ondary education.<br />
. Some figures are estimates.<br />
. Public institutions only.<br />
ource: <strong>OECD</strong> Education Database. See Annex 3 for notes.<br />
© <strong>OECD</strong> <strong>2000</strong><br />
193