OECD (2000)
OECD (2000)
OECD (2000)

Create successful ePaper yourself
Turn your PDF publications into a flip-book with our unique Google optimized e-Paper software.
F1<br />
Mathematics Achievement of Students in the 4th and 8th Grades<br />
POLICY CONTEXT<br />
This indicator shows<br />
the average mathematics<br />
achievement of students<br />
in the 4th and<br />
8th grades.<br />
International comparisons of student achievement have become an<br />
essential tool in assessing the performance of education systems. They can<br />
serve as measures of accountability that inform key stakeholders in education<br />
– such as taxpayers, employers, educators, parents and students – on the<br />
effects of their investment in education.<br />
In a world increasingly dominated by technology, mathematical knowledge<br />
and skills are central to the ability to compete in the global marketplace.<br />
Early success in mathematics is important, both because a firm foundation in<br />
basic principles is necessary before more complex materials can be mastered,<br />
and because early success can keep young people interested in this and<br />
related fields of study. It is equally important to ensure that students continue<br />
to make progress as they advance from primary to secondary education. Indicator<br />
F1 shows the relative standing of countries in mathematics achievement<br />
at both the 4th and the 8th grades.<br />
It also reflects the<br />
relative progress that<br />
students make between<br />
the two grades in<br />
different countries.<br />
The indicator also compares the progress that students in different countries<br />
make between the 4th and the 8th grades, highlighting cases where<br />
countries with poorer performance at the 4th grade are making up for some<br />
of the difference, as well as those where the achievement gap is widening<br />
between the two grade levels.<br />
It is useful to compare Indicator F1 with Indicator F2 from the 1998 edition<br />
of Education at a Glance. This indicator provided a comparison of the distribution<br />
of student achievement at the 4th and 8th grades and shed light on the extent<br />
to which education systems and societies mitigate or reinforce early educational<br />
disparities between the two grades.<br />
EVIDENCE AND EXPLANATIONS<br />
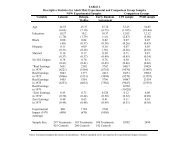
Chart F1.1 and Table F1.1 compare the mean mathematics performance of<br />
countries for both 4th and 8th grades with the international average. Chart F1.1<br />
indicates those countries with performances significantly above the <strong>OECD</strong> average<br />
and those with performances significantly below the <strong>OECD</strong> average (further<br />
details on the relative standings of countries are shown in the 1997 edition of<br />
Education at a Glance). The percentage difference in means between the two<br />
grades in Table F1.1 estimates the growth in achievement between the 4th and<br />
the 8th grade. It is calculated as the difference in average performance between<br />
the two grades relative to performance at the 4th grade.<br />
Mean performance of countries at the 4th grade<br />
Variation in mathematics<br />
achievement between<br />
countries is substantial.<br />
In mathematics, Japanese and Korean 4th-grade students score significantly<br />
higher than those in all other participating countries (457 and 471 score points<br />
respectively). In fact, the average mathematics achievement of 4th-grade students<br />
in Japan and Korea is higher than the average achievement of 8th-grade<br />
students in Portugal (Table F1.1).<br />
Fourth-grade students in the remaining countries can be classified into<br />
five groups: the Czech Republic and the Netherlands, with means of 428 and<br />
438; Australia, Austria, Hungary, Ireland and the United States, with scores<br />
somewhat above the <strong>OECD</strong> average; Canada and Scotland, with scores a little<br />
© <strong>OECD</strong> <strong>2000</strong><br />
302